
Process Variations – A Quick Way to Improve Performance
Do you want to improve your manufacturing performance and increase your bottom line? Let’s focus on the basics of Process Variations and control charts.
Updated 7 March 2025 2 min read
Do you want to improve your manufacturing performance and increase your bottom line? A smart way is to achieve process stability. To do this, track process variations and differentiate common from special-cause variations, acting only when needed. Let’s get back to basics and focus on Process Variations and Control Charts.
The Significance of Process Variations
Measuring process performance involves evaluating factors such as raw material and energy consumption or product quality, typically using averages. While averages might seem intuitive, understanding and managing variations is more valuable for plant operators. Identifying and addressing factors causing outlier results can lead to overall average improvements. According to the American Society for Quality, common causes are inherent in the process, while special causes occur under certain circumstances.
Common Cause Variation
Common cause variation arises from the inherent variability within a system due to numerous small, ever-present factors. Examples include fluctuations in energy consumption due to external elements like temperature, humidity, and energy grid fluctuations. Addressing common cause variation often involves equipment improvements or changes in work procedures, with limited influence from operators.
Special Cause Variation
Special cause variation results from factors affecting the process under nonstandard operating conditions. Discrepancies may occur, for instance, in energy consumption due to variations in product density or changes in process temperature, requiring additional pumping energy. This type of variation can be attributed to operator errors, equipment malfunctions, raw material issues, or other abnormal inputs.
Differentiating Common and Special Causes
It is imperative to distinguish between common and special causes of variation, as treating them the same can lead to inefficient changes and waste. Continuous monitoring is recommended without altering the process if the control chart indicates common cause variation. Conversely, if special cause variation is identified, prompt investigation and implementation of corrective actions are essential.
Identifying Process Variation with Control Charts
Control charts are instrumental in studying how a process evolves and identifying common and special causes of variation. Key components of a control chart include:
-
A central line representing the average,
-
An upper line for the upper control limit – UCL, positioned at 3 standard deviations above the average and,
-
A lower line for the lower control limit – LCL, positioned at 3 standard deviations below the average.
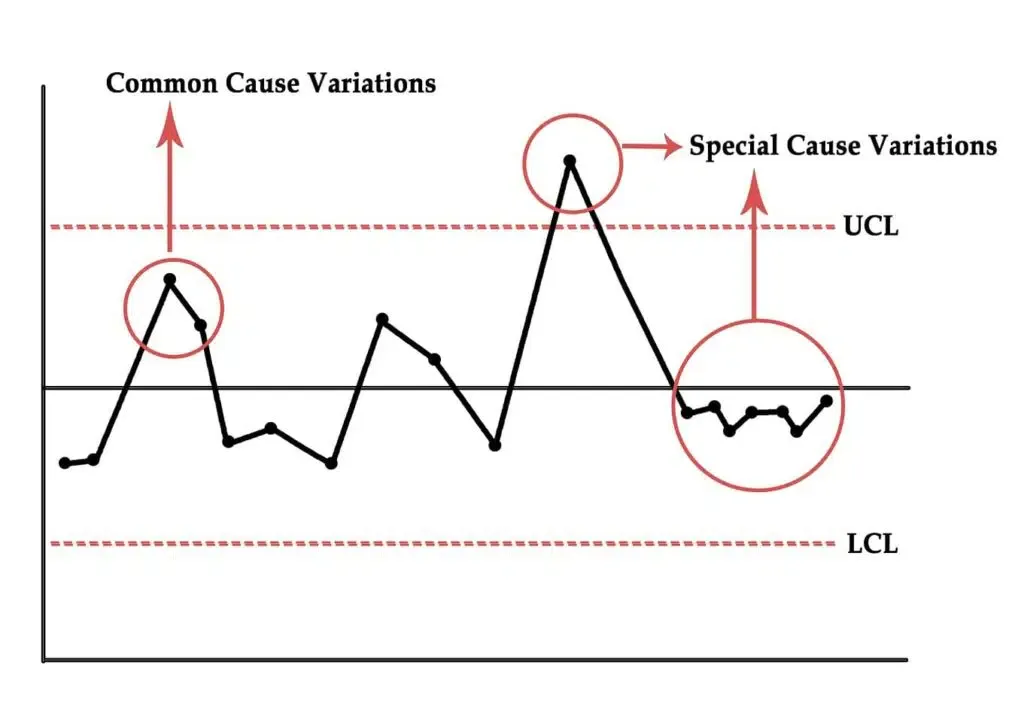 Image 1 – Control Chart Showing Common and Special Causes.
Monitoring Process Variation with the Cyzag Platform
Cyzag’s platform includes a module on Statistical Process Control (SPC), incorporating control charts and variations. The platform allows for the easy creation of control charts with set thresholds, empowering production staff to take targeted actions based on data. This not only streamlines decision-making but also serves as a powerful tool for continuous process improvements.
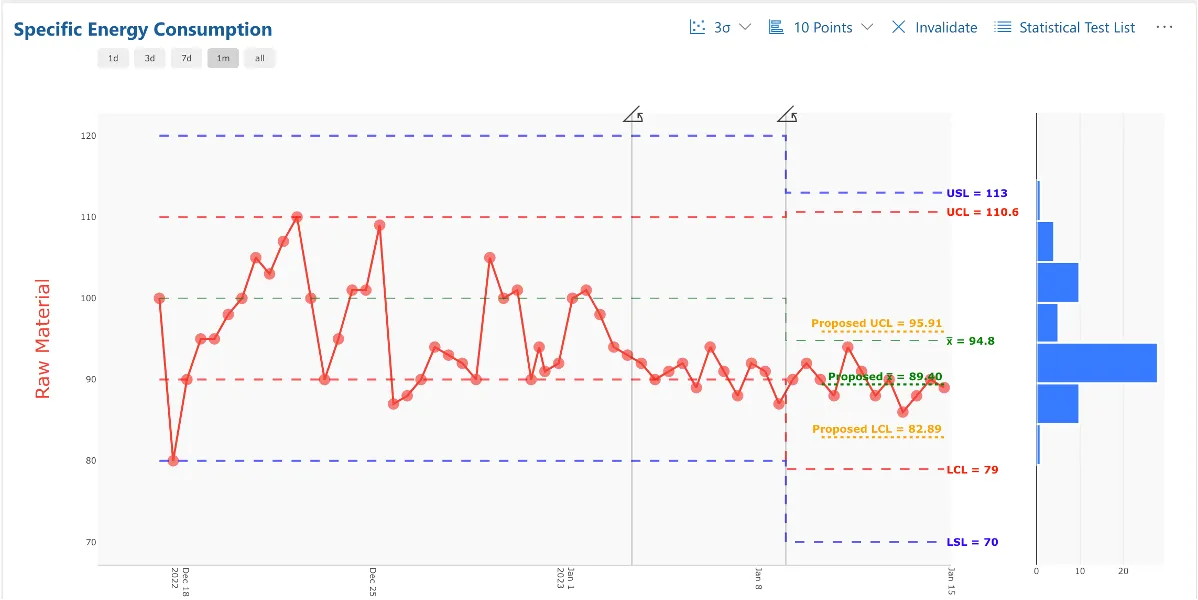 Image 2- Control Chart for Energy Consumption in the Cyzag Platform.
Conclusion
Maintaining control over process variations is not solely about achieving acceptability; it also involves ensuring the system is capable of producing satisfactory products. At Cyzag, we recognise the importance of Statistical Process Control and offer solutions that facilitate efficient monitoring, identification, and management of process variations.
Book a demo with us today to explore how our platform can enhance your decision-making processes, saving both time and money.
Follow Cyzag on LinkedIn for new articles and stories.