The ROI of AI in Industrial Operations: 7 Drivers
See where the ROI of AI in industrial operations actually comes from, seven priced drivers, not one guessed multiplier. Read the breakdown.
8 min read
Ask any operations leader about the ROI of AI in industrial operations, and you’ll usually get two different answers in the same conversation: a general sense that it should help, and a number on a slide, “3x ROI,” “40% efficiency gain,” with no formula behind it and no real explanation of what AI itself is contributing versus everything else.
A number like that doesn’t survive contact with a finance team, and it shouldn’t. The real return on digitalising a site comes from several distinct places at once: less quality cost, less raw material and utility waste, less unplanned downtime, less time lost to manual admin, and, increasingly, how much faster AI helps a team get from “something’s wrong” to “here’s why,” without losing months of shift knowledge in the process.
This article walks through where the ROI of AI in industrial operations actually comes from, and introduces the calculator that lets you run it on your own site’s numbers.
Why “It Depends” Beats a Slogan
Spend five minutes in AI content on LinkedIn and the same handful of claims keep resurfacing in slightly different wording. AI won’t take your job; someone using AI will. Learn prompting and your job is safe. The future belongs to whoever masters agents. It’s just a tool; people are still the differentiator. Start now or get left behind.
These land because they sound decisive, and decisive performs well. They rarely survive a follow-up question. Under what conditions is that actually true? For which industry, which task, which size of operation? What’s the evidence, and what does getting there cost? A claim broad enough to fit a law firm, a bank, and a chemicals plant equally well usually isn’t specific enough to guide a decision at any one of them.
The honest answer to almost any question about AI’s return right now starts with “it depends,” followed by the conditions that make it true or false. That’s the bar this calculator is trying to meet. It won’t tell you digitalising your site “will 3x your ROI.” It asks for your production volume, your off-spec rate, your downtime, your labour cost, and shows you, driver by driver, what the return depends on and how much of it moves if your numbers do.
Where the ROI of AI in Industrial Operations Actually Comes From
Every plant, terminal, and energy asset loses money in roughly the same places, even though the details look different depending on what’s on site. The calculator breaks these into seven drivers.
1. Unplanned downtime
For a process plant, this is a stoppage that better visibility could have anticipated. For a terminal, it’s a pump, valve, or loading arm failure that stalls a berth or triggers demurrage. For an energy asset, it’s an unplanned outage or a compressor trip that takes capacity offline when it didn’t need to.
2. Running the line slow to manage a suspected issue
A quieter cousin of downtime: the line doesn’t stop, but it runs below full rate while a suspected problem gets managed. It costs less per hour than a full stop, since fixed costs are still being absorbed and there’s no restart involved, so the calculator prices it separately rather than folding it into downtime.
3. Variable manufacturing cost
Product that’s still technically in-spec but made with more raw material or utility than it needed, because process drift wasn’t caught early enough. Distinct from quality cost: nothing here is unsellable, it just cost more than it should have.
4. Quality cost
Off-spec, downgraded, or scrapped product. In a terminal this looks like a blend that misses target or a cargo quality dispute; in an energy asset, fuel quality drift or emissions excursions.
5. Admin, reporting, and meeting-prep time
This is often the most underestimated. A photo taken on a phone during a round that has to be found later and filed correctly. A reading in one system while maintenance history lives in another. A tier meeting that starts late because someone’s still pulling numbers together. None of these look dramatic alone; added up across a year they usually are.
6. Onboarding and knowledge continuity
New operators and engineers take longer to reach full competency when the knowledge they need is scattered across memory, notebooks, and whoever happens to be on shift, rather than searchable from day one.
7. Audit and compliance readiness
Time spent scrambling to assemble evidence before an audit or inspection, instead of records being continuously ready.
A credible ROI estimate prices each of these separately, using numbers a site can actually provide, rather than applying one multiplier to everything and hoping it holds up.
Where AI Fits
If you’ve read our piece on AI theatre in industrial operations, you’ll recognise the pattern: an AI copilot answers a question with total confidence, based entirely on sensor history, while missing three months of shift observations that would have changed the answer completely. Nobody catches it immediately. A maintenance call gets made. The problem recurs two weeks later.
That’s not a model problem. It’s a foundation problem. RAND Corporation found that 76.4% of manufacturing AI projects failed to deliver their promised value in 2025, mostly for exactly this reason: the AI was reasoning on sensor data alone, with no access to what the operator noticed, what the last investigation concluded, or what actually worked last time. We go into this in full in our piece on AI theatre and in our whitepaper on the foundation industrial AI needs, and it’s the reason the Cyzag platform is built the way it is.
That foundation is a big part of why the ROI of AI in industrial operations isn’t priced as a single line in this calculator. All seven drivers above depend on it: automated detection and AI-assisted investigation power downtime, speed loss, VMC, and quality; automated shift reporting and handover checks power admin and meeting prep; AI-guided onboarding and continuously assembled audit evidence power the last two. The knowledge-continuity driver rests on the same idea; we’ve written before about tribal knowledge in operations, the reasoning that never made it into a procedure because it lived in one engineer’s head. New hires reach competency faster when that knowledge is searchable instead of walking out the door with whoever knew it.
What This Could Look Like on a Real Site
For a representative single-site process plant, roughly 85,000 tons of annual production, a 2% off-spec rate, around 96 hours of unplanned downtime a year, some further hours running below full rate to manage suspected issues, a handful of audits a year, and a few new hires to onboard, the seven drivers together could add up to somewhere in the range of several hundred thousand dollars in annual benefit. Running that exact example through the calculator returns roughly EUR420,000 in Year 1 benefit and payback close to three months. Depending on the site, the real number will move, sometimes substantially, but that gives a sense of the order of magnitude.
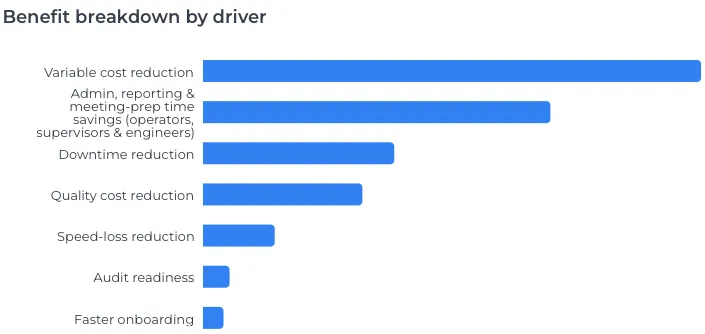 Image 1: Benefit breakdown by driver in industrial operations.
Those figures move with the inputs, sometimes substantially. A larger site, a higher off-spec rate, or more sites in scope changes the case in ways a single average never could. That’s why you should run your own numbers rather than take an illustrative example at face value: the ROI of AI in industrial operations is never the same for every site.
Sense-Check Against What’s Already Happened
-
Nobian avoided €980,000 annual savings by preventing raw material overconsumption
-
Nouryon achieved €400,000 in average savings per plant/year, scaling to 23 plants, alongside a 4x increase in operator engagement.
-
A leading specialty chemicals manufacturer saved 2 hours per shift from the first weeks of deployment.
-
Stolt Tankers doubled the frequency of its PDCA cycles across a fleet of 104 vessels.
If a modelled result looks wildly out of line with what’s already been achieved at sites like these, once scaled to size, that’s a signal to revisit the inputs before presenting the case, not to adjust the formula until it produces a bigger number.
Run the Numbers on Your Own Site
The estimate above is illustrative. Yours will be different: the ROI of AI in industrial operations depends on your own numbers, not an industry average. The ROI calculator takes about a dozen questions about your site (production volume, current off-spec rate, downtime, shift structure, audit cadence, onboarding time) and returns a driver-by-driver breakdown, your Year 1 ROI, payback period, and a 3-year view.
No download, no spreadsheet to configure. Answer what you know, and see what digitalisation could actually return for your site.
Cyzag is the AI Digital Operations Platform for asset-intensive industries. We work across process manufacturing, chemicals, energy, liquid terminals, and oil and gas.
FAQ
The following questions address common concerns about the ROI of AI in industrial operations.
How is the AI-related benefit calculated?
It’s not priced as a separate line. All seven drivers depend on it: automated detection and AI-assisted investigation power downtime, speed-loss, VMC, and quality; automated shift reporting and handover checks power admin and meeting-prep; AI-guided onboarding and continuously assembled audit evidence power the last two. Every reduction assumption is set to reflect what that AI-assisted capability realistically contributes, not the biggest number the category could support.
Does this apply to terminals and energy assets as well as process plants?
Yes. The inputs- throughput or volume, off-spec/deviation rate, downtime, labour cost, audit cadence, onboarding time- are the same categories a liquid terminal or an energy site would already track, just with different units and different examples of what each one actually looks like day to day.
How conservative are the underlying assumptions?
Deliberately so. The model applies a realisation factor that discounts the theoretical benefit to account for ramp-up and adoption time, and every driver is priced using figures the site provides rather than an industry-wide average. The goal is a number that survives a conversation with your finance team, not one that looks good on a slide.
What if our numbers don’t match the example above?
They likely won’t, and that’s the point. The example is illustrative. Your site’s off-spec rate, downtime, headcount, and labour cost will move the result substantially. Run your own figures through the calculator to see where you land.
Follow Cyzag on LinkedIn for new articles and stories.