ROI vs COI in Manufacturing: How to Quantify the Inaction
Learn how to quantify inaction with ROI vs COI in manufacturing. Practical examples show how hidden losses and missed gains shape decisions.
6 min read
In our previous article, The Cost of Inaction in Digitalisation, we explored why doing nothing is rarely neutral in manufacturing. Inefficiencies, hidden waste, and recurring deviations accumulate quietly over time, creating losses that rarely appear on a balance sheet but steadily erode competitiveness.
This follow-up article focuses on ROI vs COI in manufacturing and how both metrics can be used together to quantify the cost of inaction and the value of action. While the first article highlighted where losses emerge, this one shows how to structure those losses into practical calculations that support prioritisation and decision-making.
ROI vs COI in Manufacturing: the Difference
If the Cost of Inaction (COI) explains why waiting is costly, then ROI and COI together explain how to quantify both the benefit of acting and the price of staying exactly where you are.
Manufacturers do not lose money only through bad investments. They lose money every day through no investment, through delays, repeated mistakes, manual work, and processes that never improve. What may look like minor inefficiencies at first often compound into structural costs when left untouched.
The difference between ROI and COI is not primarily about financial impact since both can be significant. The real difference lies in visibility. ROI is usually intentional, measured, and discussed, while COI tends to accumulate quietly in areas that receive less attention.
Over time, organisations optimise what they can clearly see and justify, while less visible inefficiencies persist and grow in the background. The framework below illustrates how ROI and COI evolve over time depending on their visibility within the organisation.
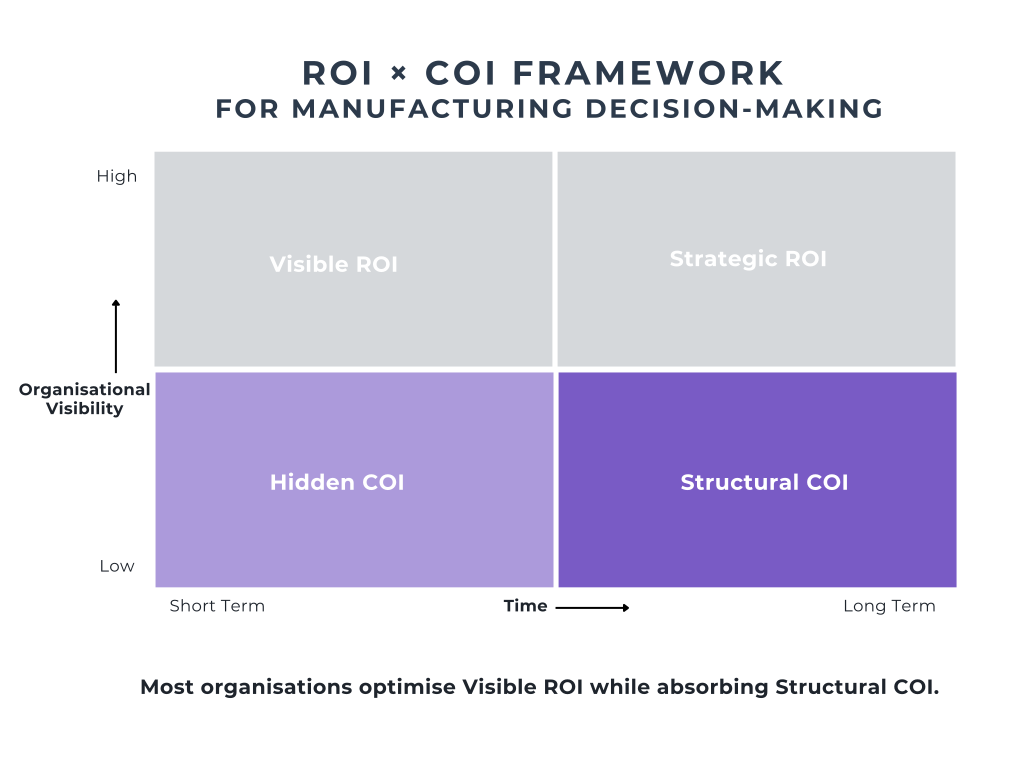 Image 1: ROI vs COI in Manufacturing: Visibility Over Time
This is why leaders need two complementary lenses. ROI measures the gains achieved after a change is implemented. COI exposes the losses that continue when nothing changes. Both rely on the same operational inputs, such as time, scrap, downtime, and labour, but they answer different questions*: If we invest, what do we gain? And if we do not invest, what else are we losing?*
It is important to clarify that the examples below do not assume headcount reduction. The financial impact reflects paid capacity consumed by non–value-adding activities, avoidable material losses, missed throughput, and risk exposure; not layoffs. The objective is direction, scale, and awareness, not financial perfection.
Examples to Make It Crystal Clear
The following examples show how the same operational data can be used either to calculate the cost of inaction or to measure the return on action.
1. Raw Material Losses from Late Deviation Detection
1.1 Current situation (Inaction): Process deviations are detected late due to manual checks or fragmented data. Off-spec material continues to be produced before corrective action is taken.
COI calculation: Average loss per deviation: €2,500 Deviations per month: 3
€2,500 × 3 × 12 months = €90,000 per year lost
1.2 After digitalisation (Action): Real-time monitoring and alerts reduce material losses by 60%.
ROI calculation: €90,000 × 60% = €54,000 per year recovered
1.3 Key Takeaways Material losses are among the most tangible forms of COI. Faster detection turns waste into recoverable value.
2. Increased Throughput by Correcting Deviations from the Golden Batch
2.1 Current situation (Inaction): Production gradually drifts away from the golden batch. Deviations are detected late, leading to slower cycles, rework, or reduced output before corrections are made.
COI calculation: Lost throughput per day: 2% Annual production value: €5,000,000
€5,000,000 × 2% = €100,000 per year of unrealised output
This is COI, the capacity that exists but is not fully realised.
2.2 After digitalisation (Action): Early detection of batch deviations allows operators to correct parameters on the fly. Throughput loss is reduced by 75%.
ROI calculation: €100,000 × 75% = €75,000 per year of recovered throughput
2.3 Key Takeaways Not all losses appear as waste; some appear as output that never materialises.
3. Recurring Quality Deviations That Go Unresolved
3.1 Current situation (Inaction): A deviation occurs every month, generating €4,000 in scrap and rework. Because root cause analysis is manual and delayed, the same issue repeats throughout the year.
COI calculation: €4,000 per month × 12 months = €48,000 per year lost
This is COI, a recurring loss that persists until as long as the deviation remains unresolved.
3.2 After digitalisation (Action): Earlier detection and automated alerts allow teams to act sooner. Scrap is reduced by 70%.
ROI calculation: Annual avoidable loss: €48,000 Reduction achieved: 70%
€48,000 × 70% = €33,600 saved per year
3.3 Key takeaway: COI shows the full annual cost of a deviation that repeats unchecked (€48,000). ROI shows the portion of that cost that can be realistically avoided once the issue becomes visible and actionable (€33,600).
4. Safety Risk Exposure from Manual LOTOTO Processes
4.1 Current situation (Inaction): Manual lockout–tagout processes rely on paper, verbal confirmation, and fragmented records. Limited visibility increases the risk of missed isolations and near misses.
COI estimation: Average cost per incident or serious near miss: €15,000 Incidents per year: 2
€15,000 × 2 = €30,000 per year of risk exposure
4.2 After digitalisation (Action): Digital LOTOTO enforces verification, sequencing, and traceability, reducing risk by 70%.
ROI calculation: €30,000 × 70% = €21,000 per year of risk avoided
4.3 Key takeaway: Some forms of COI do not appear as regular losses, but as ongoing exposure to low-frequency, high-impact risks. Digital controls reduce the likelihood and severity of these events.
5. Manual Logs: A Cost of Inaction Example in Manufacturing
5.1 Current situation (Inaction): Operators spend two hours per week on manual logging activities. Across 30 operators, this administrative effort becomes a recurring operational loss.
COI calculation: 2 hours × 30 operators × €30/hour × 52 weeks = €93,600 per year wasted
This is COI, the cost of continuing with the same manual process.
5.2 After digitalisation (Action): Log entries drop from two hours to just 15 minutes per week.
ROI calculation: Time saved per operator per week: 2 hours − 0.25 hours = 1.75 hours
Annual hours saved: 1.75 hours × 30 operators × 52 weeks = 2,730 hours
Financial gain: 2,730 hours × €30/hour = €81,900 per year recovered
5.3 Key takeaway: The inputs are the same (time and labour), but the outcome depends entirely on whether you are measuring the cost of inaction (€93,600 lost) or the return on action (€81,900 gained).
ROI is often slightly lower than COI because not every loss can be entirely eliminated. However, reducing even part of a recurring loss quickly delivers meaningful financial impact.
Examples Summary Table: ROI vs COI in Manufacturing
The table below summarises the examples above, highlighting how COI and ROI appear across different operational areas.
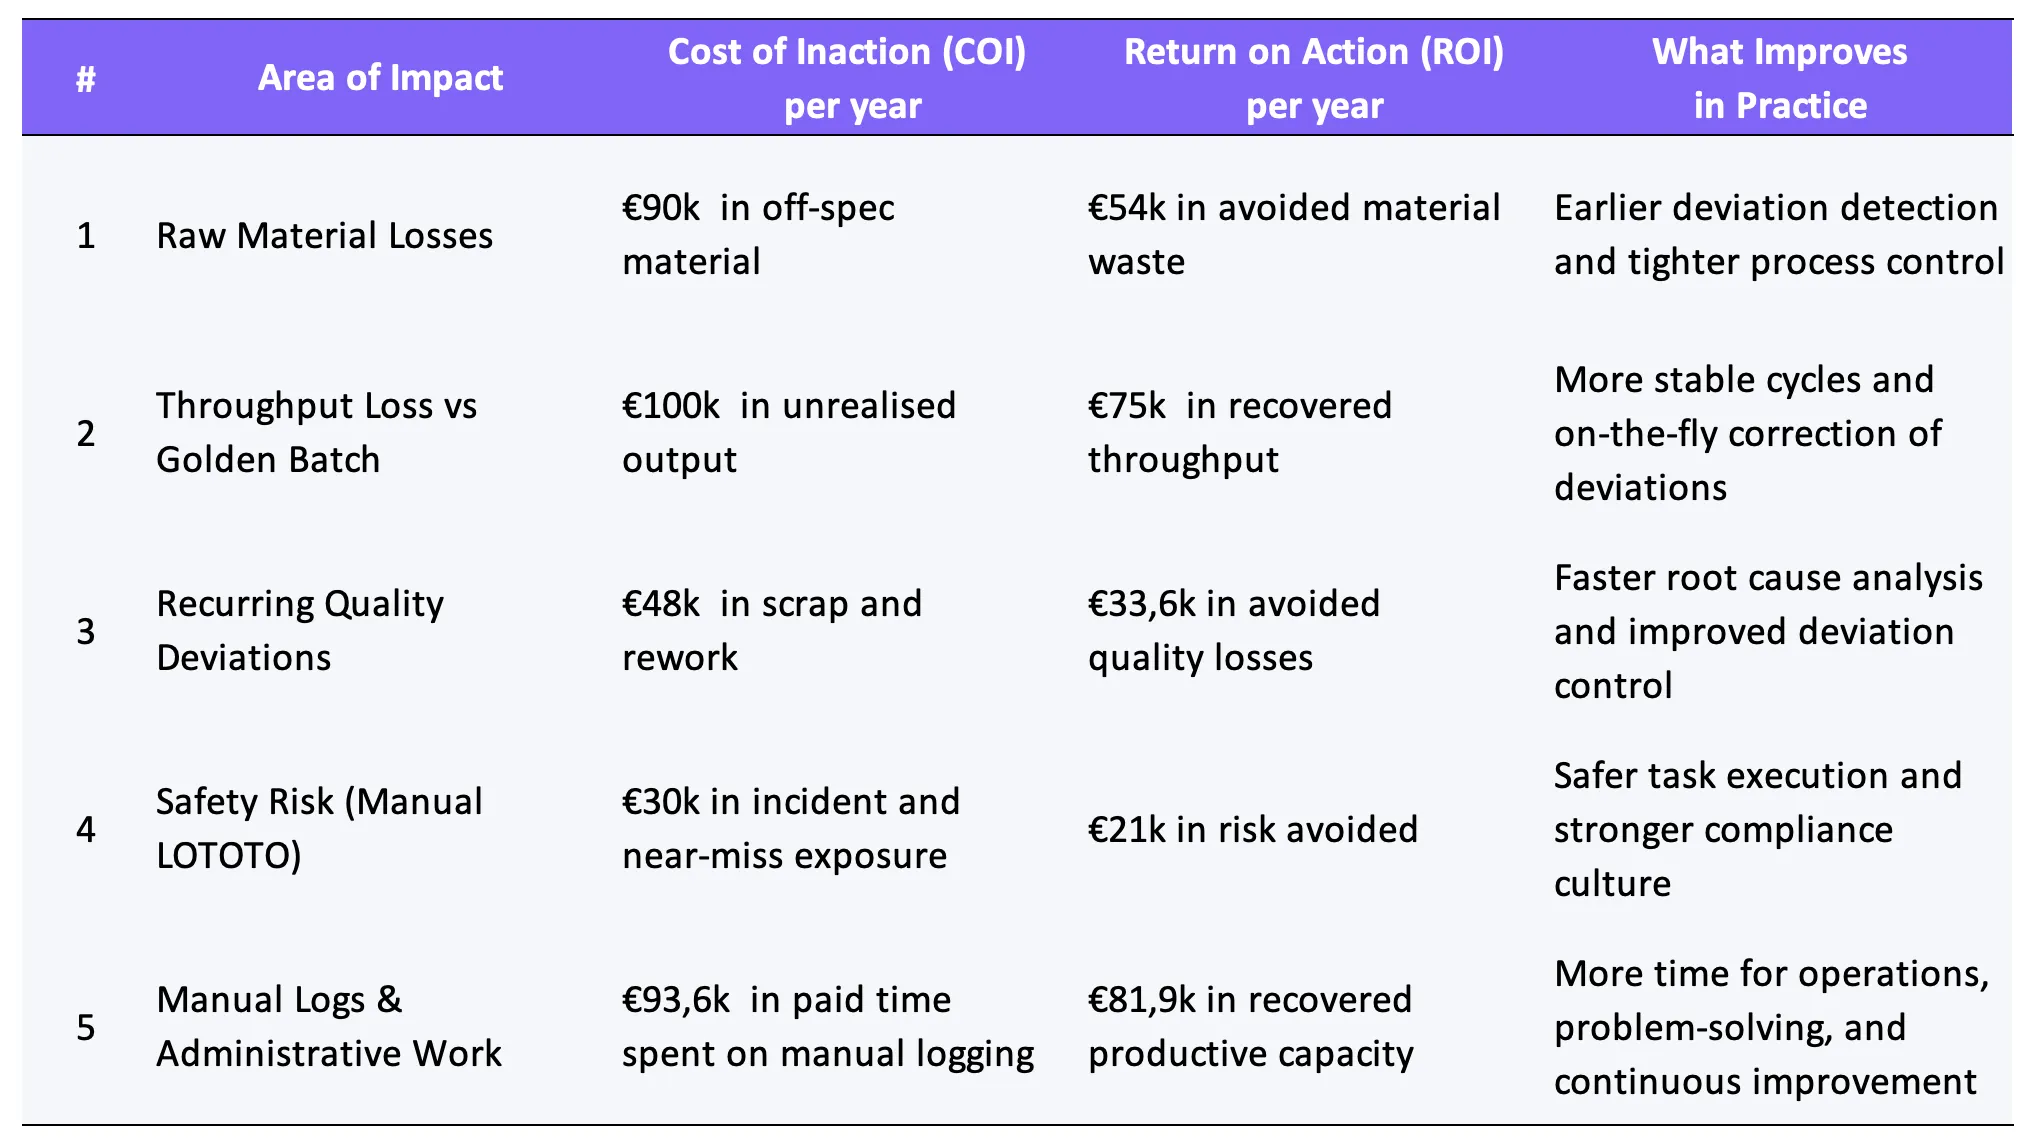 Image 2: ROI vs COI Examples in Manufacturing – Summary Table
Taken together, the examples show that COI and ROI span multiple dimensions of manufacturing performance. Some impacts are primarily capacity-related, such as time, waiting, and coordination. Others are directly linked to material consumption and variable costs, throughput, and yield. A third group reflects operational risk and exposure, where losses may be less frequent but potentially more severe. The relative importance of each area depends on the plant’s specific context, but the pattern is consistent: less visible costs tend to persist longer.
Closing the Loop with the Cost of Inaction
In the first article, The Cost of Inaction in Digitalisation, we highlighted where hidden losses typically emerge across manufacturing operations. This follow-up translates those losses into financial terms that leaders can use to prioritise action.
COI shows the price of standing still. ROI shows the value of moving forward. They are not competing metrics; they are complementary views of the same operational reality.
When both are used together, decisions become clearer, not because the numbers are perfect, but because the trade-offs are visible. And in manufacturing, visibility is often the difference between reacting late and acting in time.
If you want to take action to digitalise your operations now, book a demo to get help calculating your ROI and COI.
Follow Cyzag on LinkedIn for new articles and stories.