How to Use an Operations Map to Make Manufacturing More Efficient
Learn how an operations map can boost manufacturing efficiency by streamlining workflows, improving processes, and eliminating bottlenecks.
Updated 22 May 2025 8 min read
In manufacturing, inefficiencies are often hidden in plain sight, quietly eroding profitability. According to research firm IDC, inefficiency costs companies anywhere from 20% to 30% of their annual revenue. Manual processes, disconnected systems, and data silos contribute to these losses, increasing costs and slowing operations—but because they blend into daily routines, they often go unnoticed. An operations map can be a simple yet powerful tool to make these inefficiencies visible, allowing teams to streamline workflows, reduce waste, and work smarter.
What Is an Operations Map?
An operations map is a simple yet powerful visual management tool developed by Cyzag as part of our digitalisation methodology. It illustrates how tools, teams, processes, and data interact across industrial operations. Unlike traditional process maps, it provides a broader perspective, highlighting key activities, tools, manual versus automated workflows, and data flows.
This map is essential throughout a digitalisation initiative. It is used before, during, and after the initiative to illustrate the current state, define the desired state, and monitor progress towards that goal. Additionally, it serves as a foundation for ROI (return on investment) analysis, enabling manufacturers to quantify the financial impact of digital transformation.
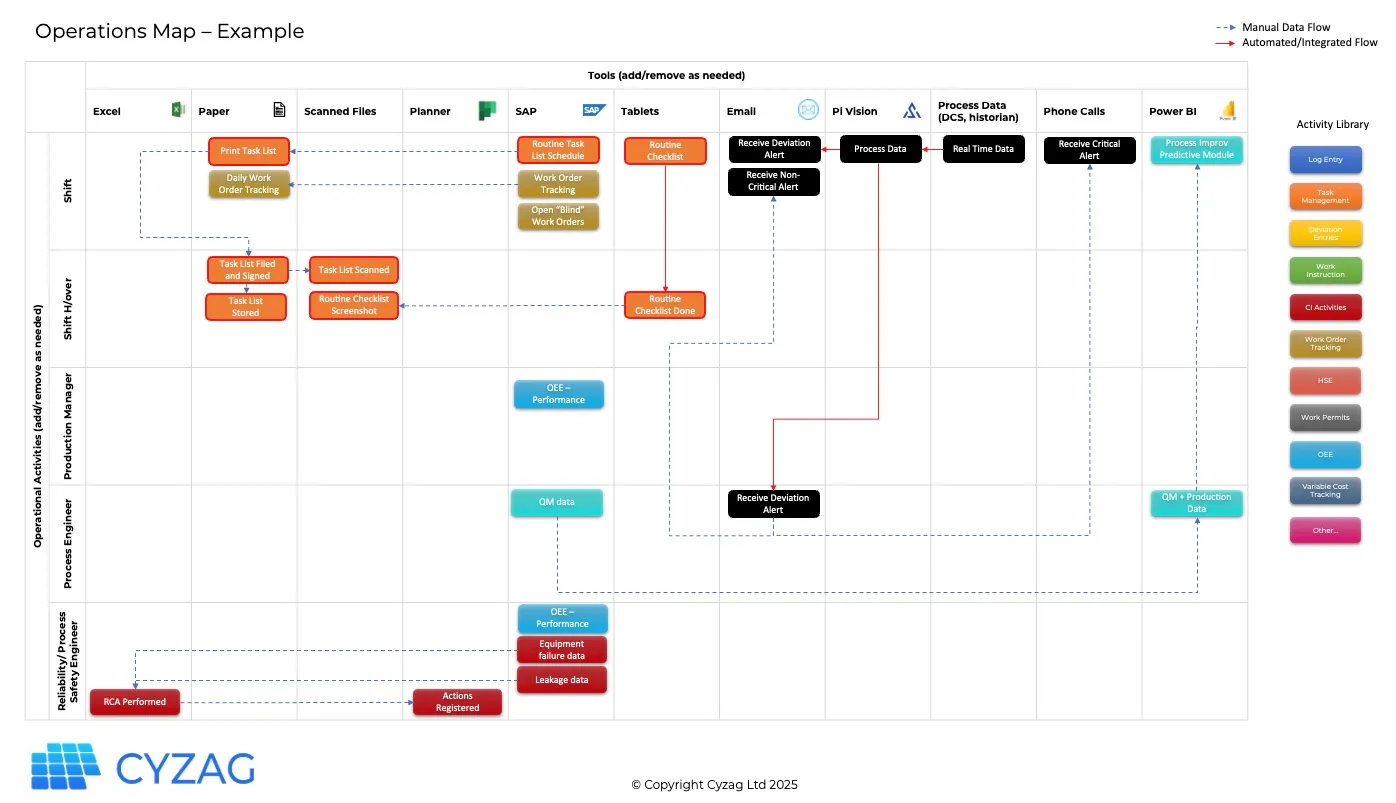 Image 1 – An example of the operations map developed by Cyzag.
By leveraging the Cyzag operations map, businesses can:
-
Identify hidden inefficiencies in workflows
-
Pinpoint data silos and fragmented systems
-
Understand interdependencies between tools and workflows
As digitalisation progresses, an operations map also helps rethink how technology can streamline operations and enhance decision-making.
Steps to Create a Simplified Operations Map
A well-structured operations map makes inefficiencies visible, streamlining workflows and improving data flow. Follow these steps to build one effectively:
Step 1: Define the Scope of the Operations Map
Start small. While the goal is to eliminate all inefficiencies, focus on one specific area, process, or team first. This prevents unnecessary complexity and makes the process manageable. You can repeat it as needed.
For example, let’s take a manufacturer in the process industry aiming to improve control room operations. The company sets the daily routine of control room operators as the scope of the operations map.
Step 2: List Operational Activities
Identify key operational activities within the chosen scope. Keep it general at this stage—details come later. In our example, the activities mapped include:
-
Shift process work
-
Shift performance meeting
-
Daily maintenance meeting
These are positioned on the left side of the operations map, as illustrated in the following image.
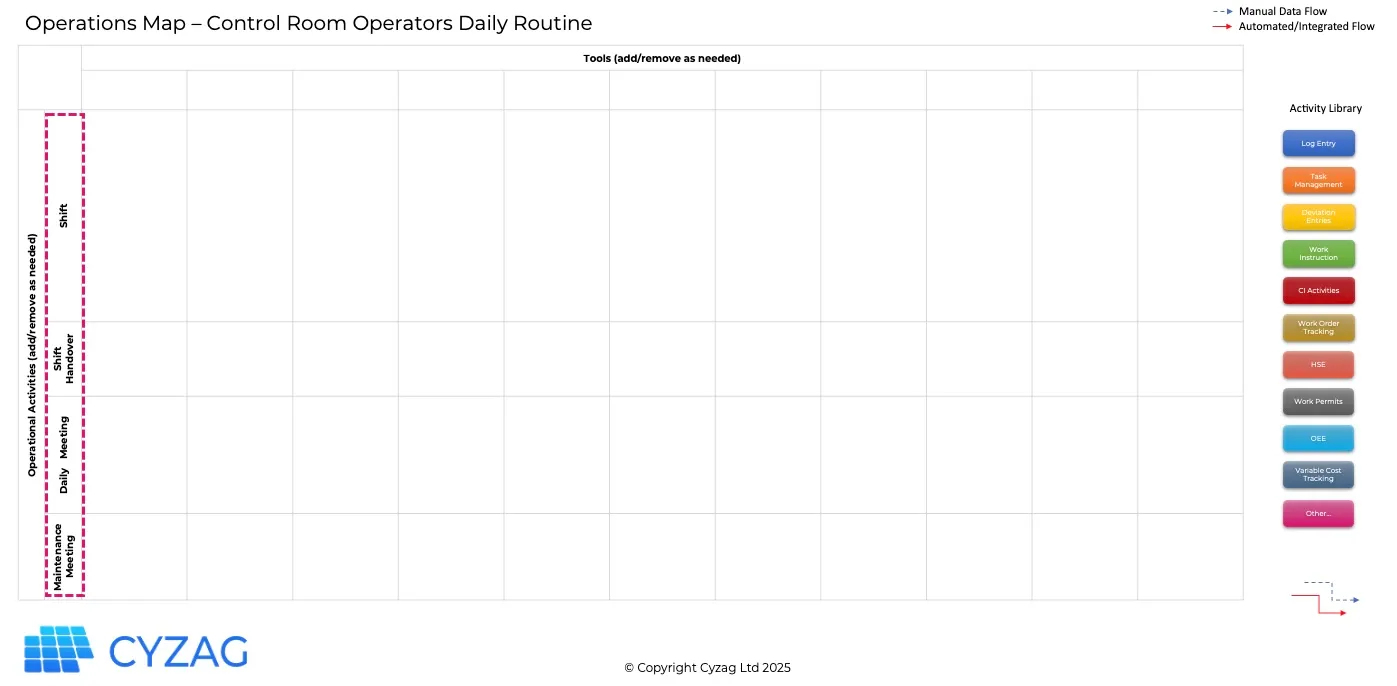 Image 2 – The Second Step to Build the Operations Map: Add Activities
Step 3: Identify Tools and Systems
List all tools or platforms used for that scoped work, such as:
-
Digital tools: DCS, historian, SAP, Excel, SharePoint.
-
Physical tools: Whiteboards, printed documents, manual logs.
-
Communication tools: Email, phone, messaging apps.
This information is added to the top side of the map.
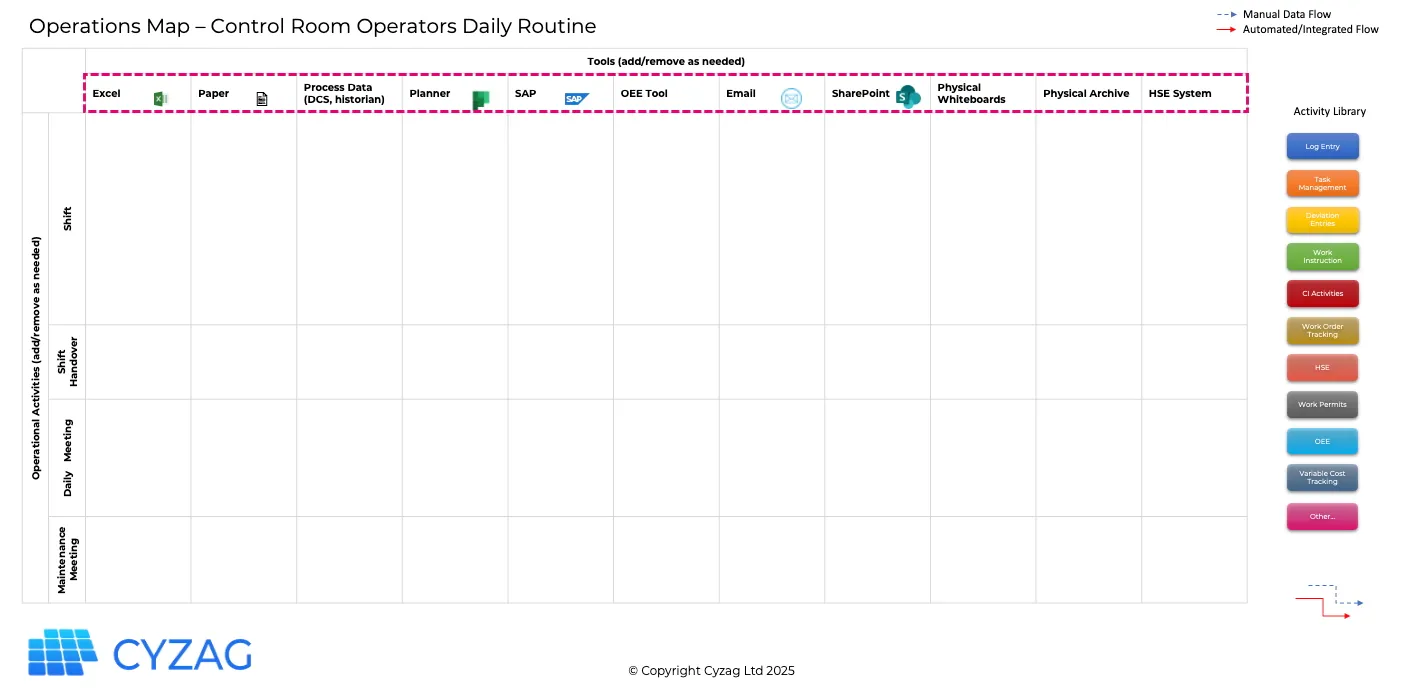 Image 3 – The Third Step to Build the Operations Map: Add Tools and Systems
Step 4: Detail the Operational Activities
Now, connect specific tasks to the broader activities and their corresponding tools.
For instance, in our example:
-
The control room operator starts the shift by logging entries, consulting real-time data from the DCS, organising tasks, and preparing work permits, which include LOTOTO (Lockout, Tagout, Tryout) lists.
-
These activities are placed in the appropriate section of the operations map to illustrate their connection to tools and workflows.
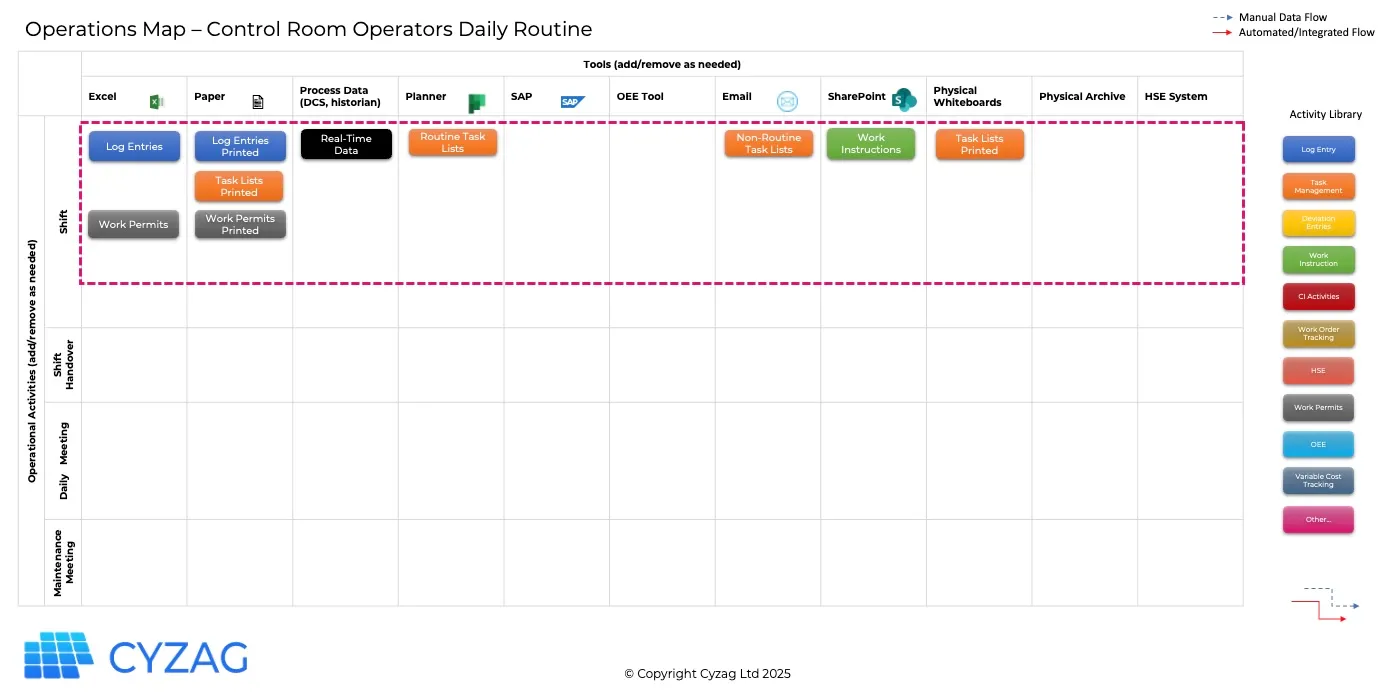 Image 4- The Fourth Step to Build the Operations Map: Detail Activities
💡 Tip: Use colour coding to differentiate task types and make the map clearer. Common categories in manufacturing plants include:
-
Log Entry
-
Task Management/ Routine Management
-
Standardised Work Instruction
-
Deviation Entry
-
Work Permits
-
HSE (Health, Safety, Environmental)
-
KPIs (Key PerformanceIndicators)
-
Work Order Tracking
-
OEE (Overall Equipment Effectiveness)
-
Variable Cost Tracking
-
Continuous Improvement (CI) Activities
These can be customised based on the type of work being mapped.
Step 5: Trace Data Flows
The next step is to map how data moves between tools and processes, clearly distinguishing between manual and automated workflows. Use dotted blue lines to represent manual flows and solid red lines for automated flows.
As you map data flows, you may notice missing details. Add them as you refine the map. In our example:
-
Blank log entries are manually retrieved from Excel, printed, and filled out using DCS real-time data. At the end of the shift, completed logs are physically signed and archived.
-
Routine task lists are retrieved from Planner, while the production supervisor emails non-routine tasks daily. Both are printed and posted on a physical whiteboard for task allocation. At the end of the shift, task lists are physically signed and archived, independent of completion.
-
Work permits are prepared and printed in Excel a day in advance. Relevant work instructions are retrieved from SharePoint, and initial permit fields are pre-filled. The following day, the permits are ready for LOTOTO execution and sign-off in the field.
The image below represents the initial state of the operations map.
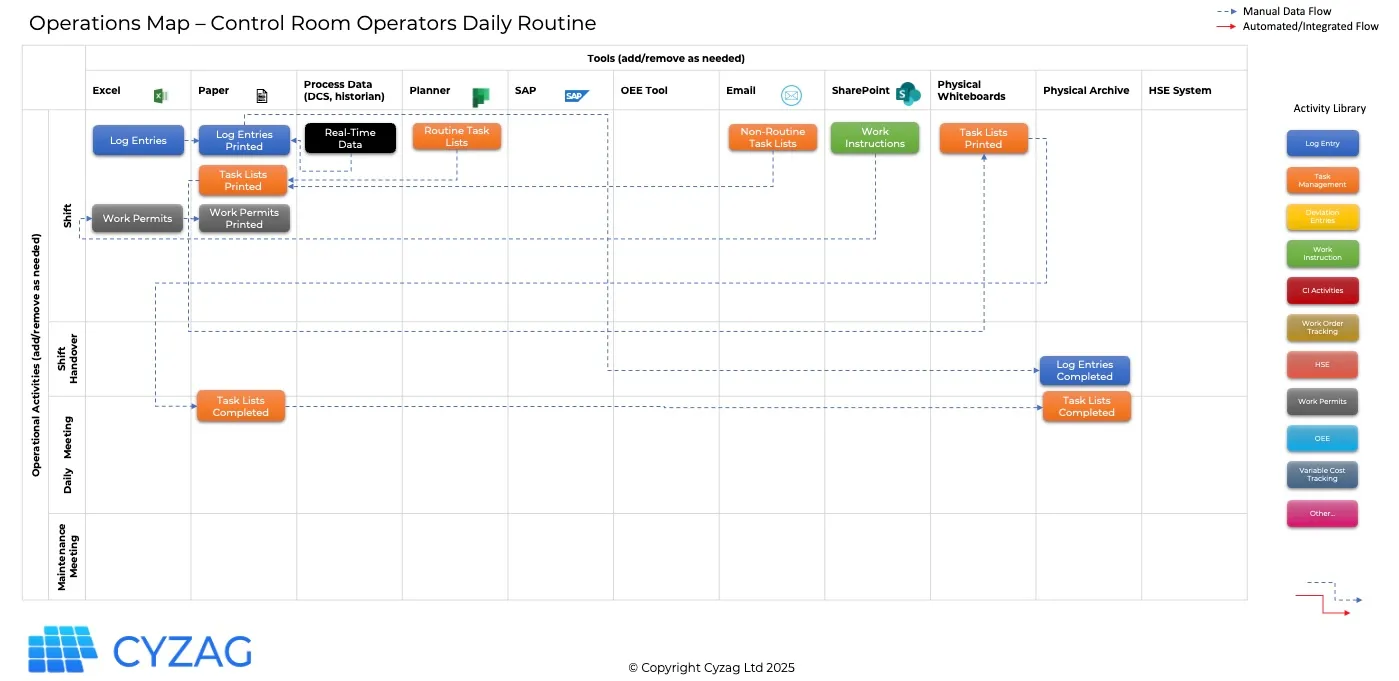 Image 5- The Fifth Step to Build the Operations Map: Trace Data Flows
Once adding all day-to-day tasks, the operations map clearly visualises workflows, emphasising the complexity of processes. The final version of the map offers a comprehensive view of the entire process, as shown in the following image.
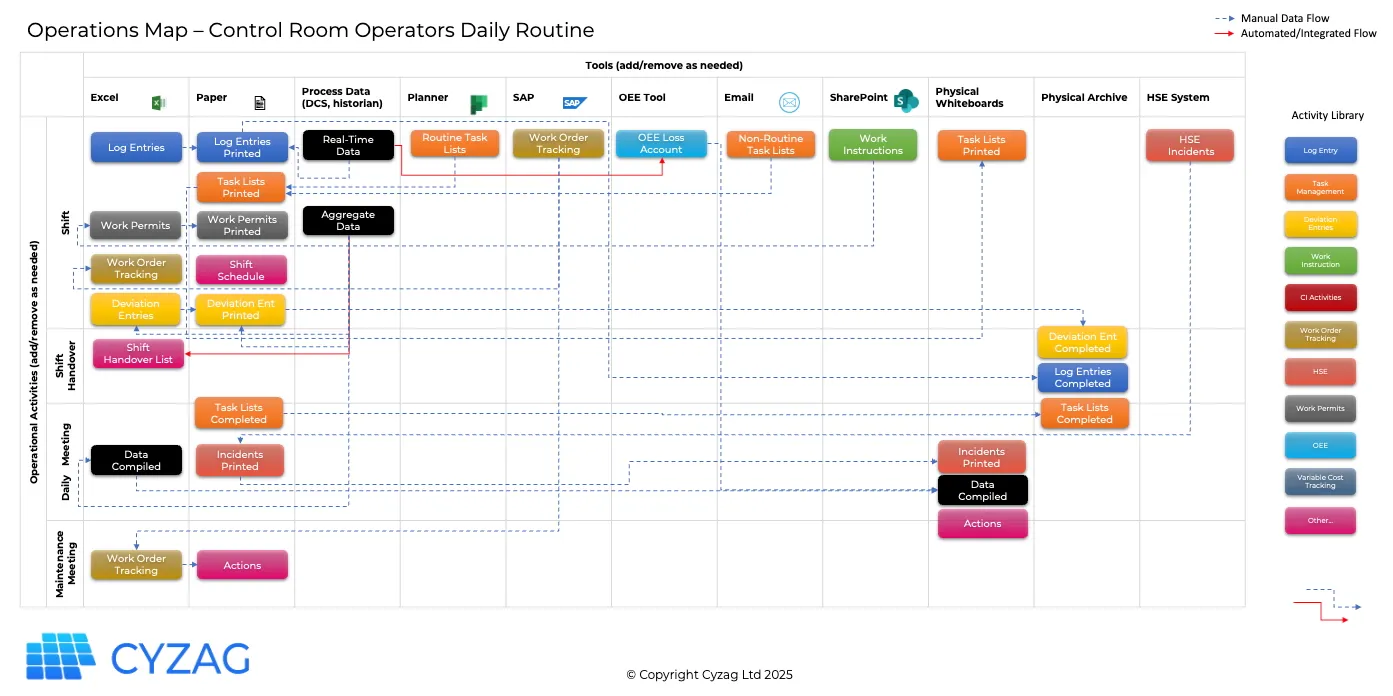 Image 6- The Last Step to Build the Operations Map: Complete all Activities + Data Flows
Identifying Opportunities in the Operations Map
With the operations map complete, it’s time to analyse and improve. The map reveals complexities and inefficiencies, helping identify opportunities for simplification and increased efficiency. Key areas to assess include:
Technology Gaps and Data Silos
Disconnected systems, excessive tools, and data silos create inefficiencies, increase costs, and limit real-time decision-making. Legacy systems often require costly maintenance and lack seamless integration, preventing teams from accessing and leveraging critical data. When data is trapped in isolated tools, such as the Planner, OEE tool, SAP, SharePoint, and HSE system, decision-making slows, inconsistencies arise, and operational transparency suffers.
Evaluate whether all the tools used are truly necessary. Modern no-code digital platforms provide a scalable and cost-effective alternative, integrating multiple processes into a single, connected ecosystem. Eliminating data silos by enabling seamless data sharing across systems enhances visibility, reduces reliance on outdated tools, and improves overall operational efficiency.
Manual Processes Bottlenecks
Manual workflows are often fragmented, inefficient, and prone to errors. Tasks that require multiple steps—such as log entries, deviation tracking, and work permits—often involve manual extractions, printouts, physical signatures, and archiving. These steps make it difficult to conduct trend analysis, perform root-cause investigations, and maintain up-to-date records.
Additionally, isolated tasks—such as those recorded on paper or whiteboards—lack visibility, making it harder to track progress and ensure accountability. Without a structured system, teams must rely on physical checks, increasing the risk of missed or delayed tasks.
Replacing these multi-step manual processes with digital solutions streamlines work, enhances collaboration, and ensures seamless access to real-time data. A structured digital task management system ensures clear responsibilities, deadlines, and follow-ups, eliminating time wasters, improving efficiency and reducing operational risks.
Leveraging Digitalisation for Operational Efficiency
Cyzag empowers manufacturers to eliminate data silos, automate workflows, and gain real-time operational visibility—all within a single, integrated platform. By replacing scattered tools and paper-based processes, Cyzag platform keeps teams connected, streamlining operations for greater efficiency.
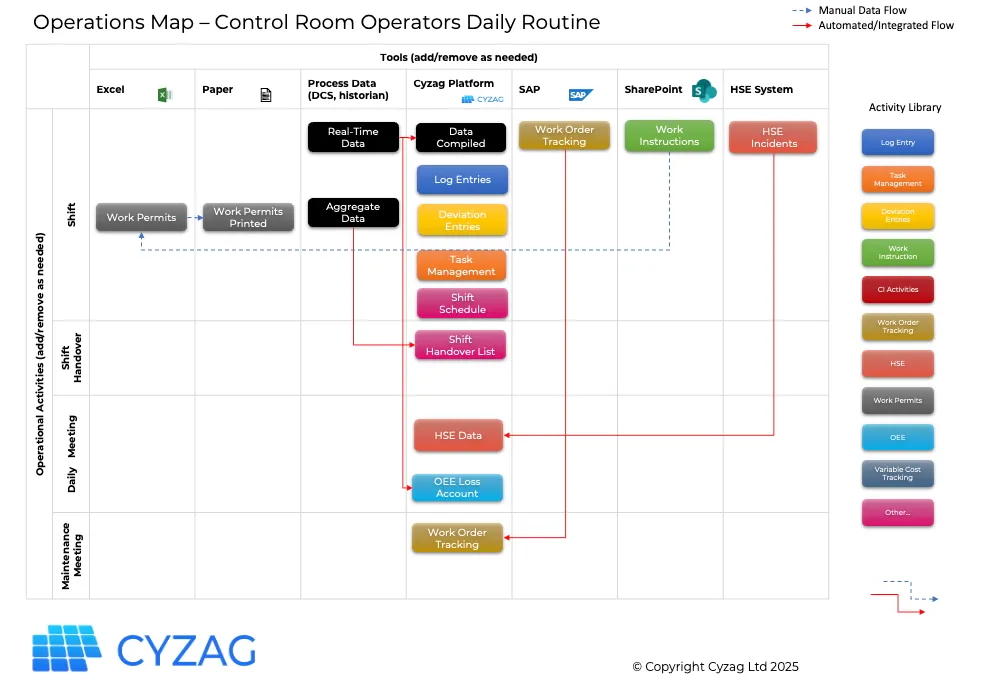 Image 7 – Optimised operations map after implementing the Cyzag platform
In our example, the operations map reveals key inefficiencies: data silos, redundant tools, and manual workflows that slow down manufacturing and waste valuable hours of employees’ time. These bottlenecks not only reduce efficiency but also delay critical decision-making. By consolidating systems, automating routine tasks, and centralising real-time data, Cyzag streamlines operations—eliminating unnecessary delays and freeing up to two hours per shift, enabling teams to focus on higher-value tasks.
With automated task scheduling, logging, and reporting, Cyzag enables teams—from operators to executives—to work with real-time visual workflows, ensuring seamless communication and continuous improvement. The revised operations map and summary, after implementing Cyzag, reflect a more integrated, efficient, and data-driven process.
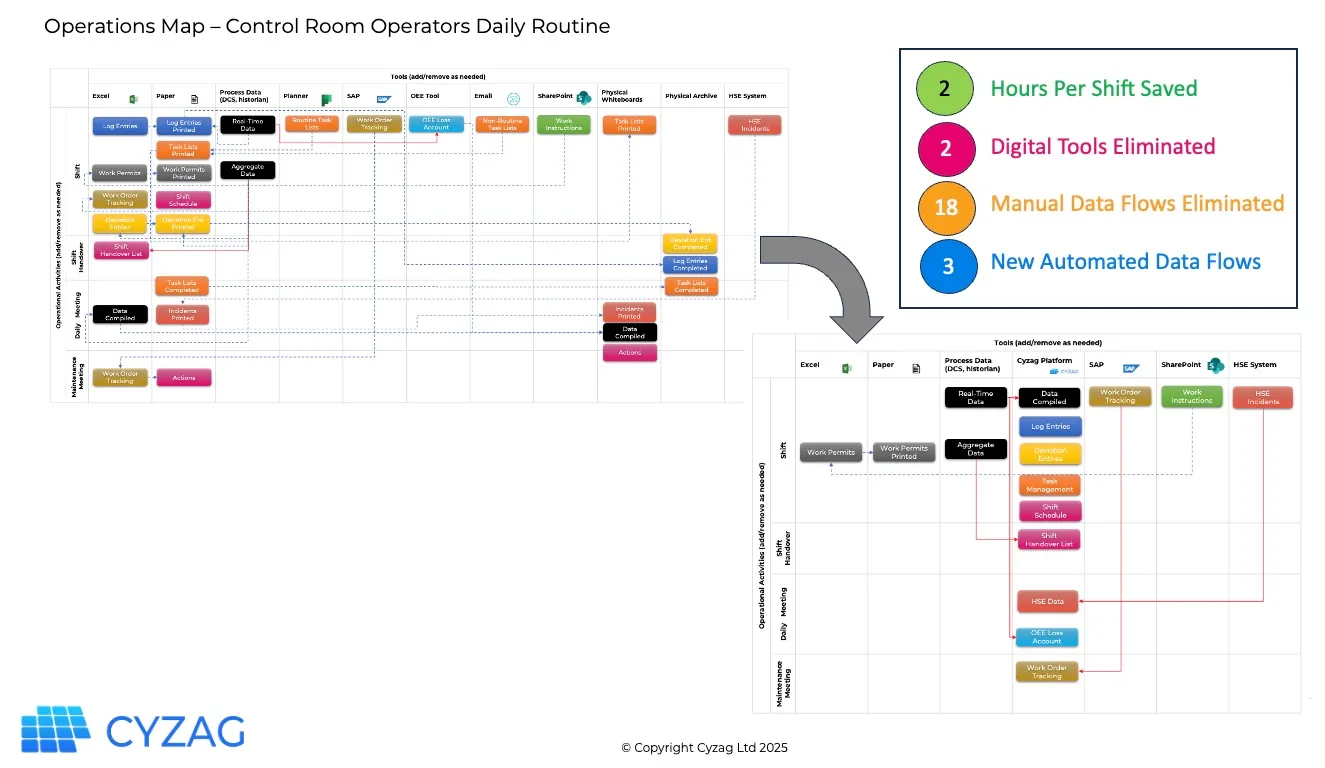 Image 8 – Comparison of the operations map before and after Cyzag platform implementation.
And this is just the beginning—ongoing improvement cycles will continue driving operational excellence.
The Value of an Operations Map: Key Takeaway
By implementing the operations map developed by Cyzag, manufacturers gain clearer workflows, stronger collaboration, and increased efficiency. It also provides a data-driven foundation for identifying cost savings and calculating the Return on Investment (ROI) of digitalisation initiatives. With a well-structured operations map, manufacturers can quantify inefficiencies, track improvements, and justify investments with concrete numbers.
The key benefits of an operations map include:
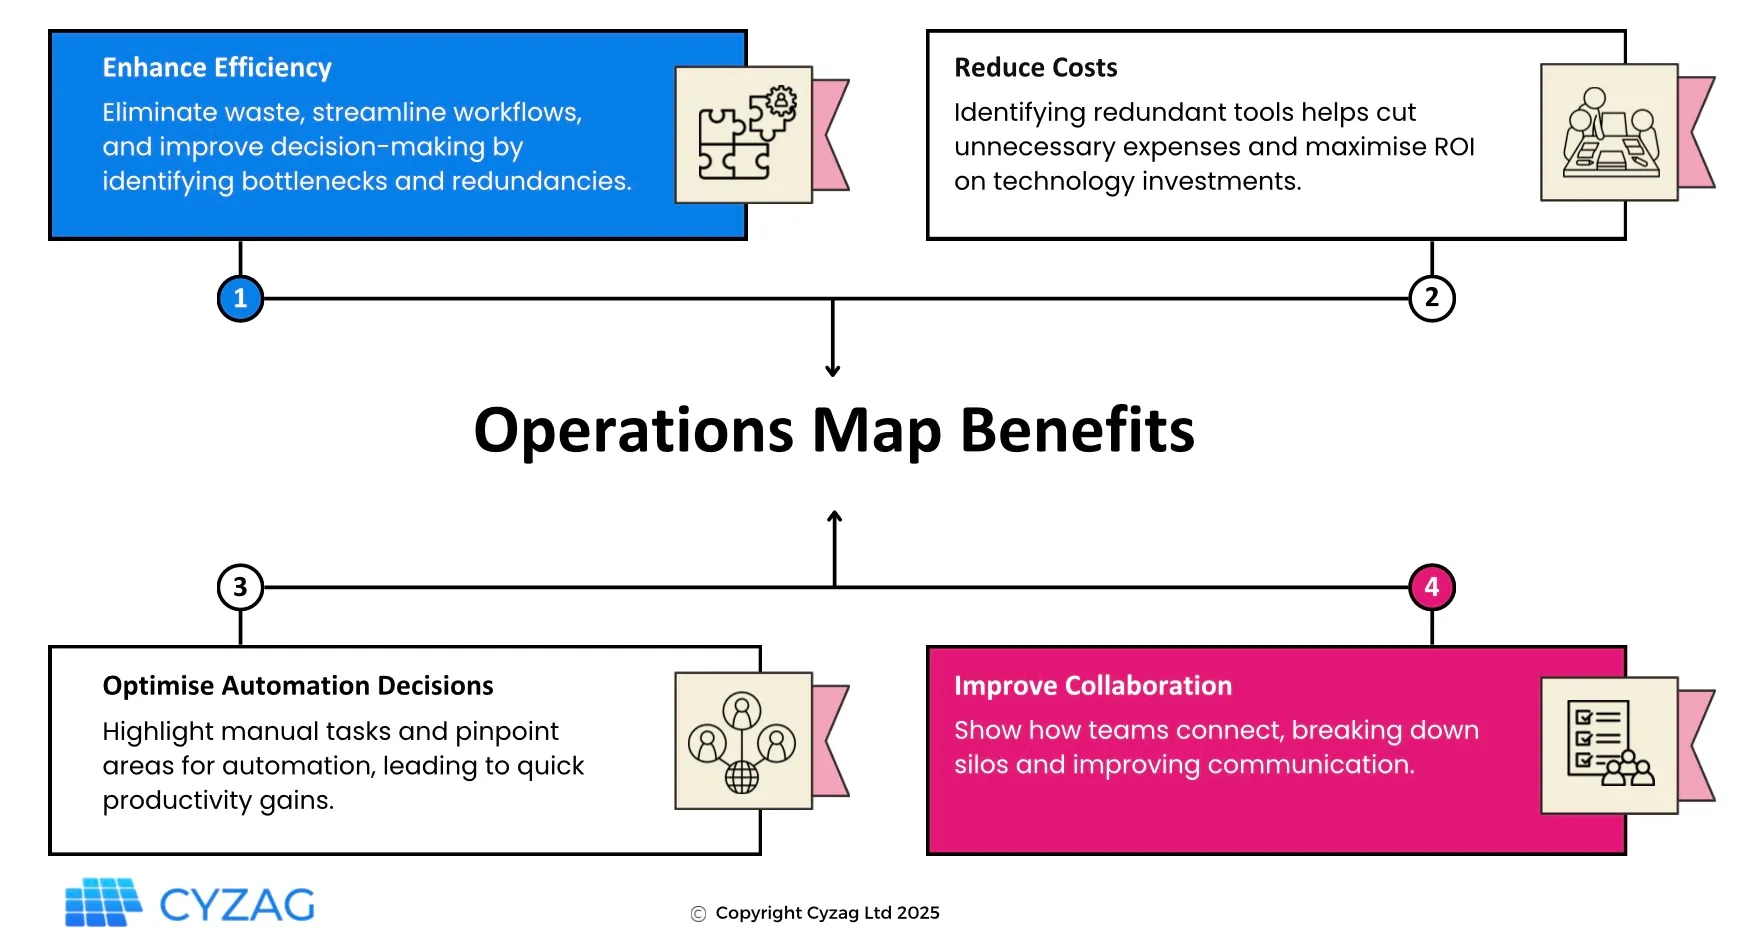 Image 9 – Operations Map Benefits
The operations map is more than just a tool—it’s the foundation for a smarter, more connected, and data-driven manufacturing process. However, identifying inefficiencies is just the beginning. To truly transform operations, manufacturers need the right digital platform.
Cyzag helps bridge these gaps by eliminating data silos, automating workflows, and providing real-time operational visibility in a unified digital ecosystem.
Book a demo today to start your journey towards a more efficient and connected operation with Cyzag.
Follow Cyzag on LinkedIn for new articles and stories.