
How to Start with Process Improvement: Tools
Discover essential tools to initiate process improvements and boost efficiency on the manufacturing floor in our 3-part series.
Updated 18 May 2025 22 min read
In the process industry, the effective implementation of process improvement strategies is crucially dependent not just on the people and processes involved but also on the tools that support these efforts. This final piece in our trilogy explores essential tools that enhance efficiency, quality, and sustainability in manufacturing operations.
 *Image 1. The three aspects of manufacturing efficiency: People, Processes, and Tools. *
Tools: Bridging People and Process for Efficiency
Process improvement tools are instrumental in effectively implementing and sustaining enhancements. They help identify, analyse, and correct inefficiencies within production processes.
Whether through traditional manual tools or advanced digital solutions, the appropriate tools can significantly streamline operations and boost productivity. As David Allen, author of ‘Getting Things Done’, humorously notes, ‘If the only tool you have is a hammer, it’s hard to eat spaghetti.’ This emphasises the need for a diverse toolkit that goes beyond the conventional, ensuring the right tool for every task.
However, understanding and optimising the existing processes is essential before introducing new tools. There is often a misconception that a new tool can resolve ongoing issues with people and processes, but this is rarely the case. We will explore some critical tools and their effective integration with process improvement methodologies, fostering a cohesive and efficient manufacturing ecosystem that effectively supports your workforce.
Key Tools for Process Improvement
Most process improvement tools have specific origins and were developed within methodologies like Lean, Six Sigma, TPM (Total Productive Maintenance), and TQM (Total Quality Management). Still, they are versatile and can be adapted to suit the unique needs of different manufacturing organisations.
The flexibility to customise and combine these tools allows businesses to target their specific goals, align with their operational realities, and respect their organisational maturity, thereby enabling more effective and tailored process improvements.
In the following sections, we will explore the most valuable and efficient tools for the chemical and process industries. To clarify their application and impact, we will organise them into six different categories according to their functional roles within process improvement initiatives:
Let’s explore each of these categories.
1. Visualisation and Workflow Improvement Tools
Visualisation and Workflow Improvement Tools are crucial in enhancing efficiency and organisation within a workplace. These tools provide systematic approaches to optimising workflows, streamlining processes, and visualising work progress. Among the most widely recognised tools in this category are 5S and Kanban. These tools go beyond mere organisation; they empower teams to optimise their processes, minimise waste, and deliver value efficiently.
5S
The 5S method is crucial in manufacturing for establishing a disciplined, efficient, and safe work environment. Organisations can significantly reduce waste and enhance productivity by following its five-step process: sorting, setting in order, shining (cleaning), standardising, and sustaining.
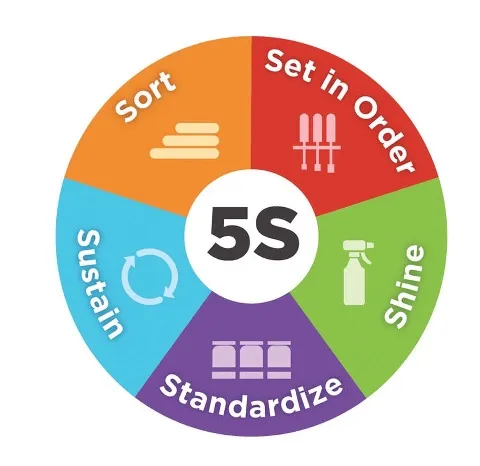 Image 2. 5S Process Steps.
Implementing 5S has improved safety, raised equipment availability, decreased defect rates, cut costs, and boosted production flexibility. It is a solid foundation for more advanced lean production tools, processes, and total productive maintenance systems.
5S is usually seen as a method applied in physical environments like manufacturing or office spaces. However, it is versatile enough to be used in digital contexts. It helps manage necessary documentation and avoid unnecessary systems and files.
Kanban
Kanban is a visual tool that effectively promotes workflow and limits work-in-process (WIP) inventory to enhance throughput and prevent excess inventory buildup at any production stage. It establishes and then reduces limits on the number of items at supply points, directly addressing inefficiencies as they are identified.
Originating from the Japanese for “sign” or “signboard,” Kanban relies heavily on cards to manage material movements within a production facility or from external suppliers. These Kanban cards serve as notifications for depleting products, parts, or inventory, triggering necessary replenishments. This mechanism ensures that production demand is driven by actual consumption, creating a demand-driven system called a pulled system.
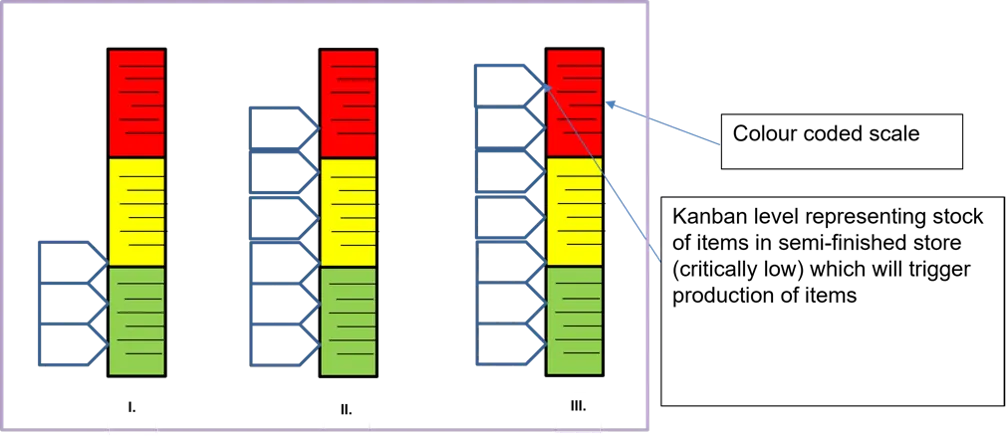 Image 3. Production scheduling board using Kanban.
Kanban also manages team workflows by limiting WIP to prevent overburdening and aligning work intake with available capacity. Variability in tasks and workflow dynamics might lead to temporary idleness, signalling opportunities for process improvement and providing slack for implementing these enhancements.
Visualisations in Kanban allow workers to leverage their emotional intelligence, enhancing their understanding of the work and its dynamics, thus reducing coordination efforts and boosting quality. Limiting WIP decreases lead times by minimising multi-tasking and reducing task switching through strategic system design and staff allocation. When implementing Kanban to enhance business efficiency, organisations can use digital or physical boards to accelerate operational processes and promote workplace productivity.
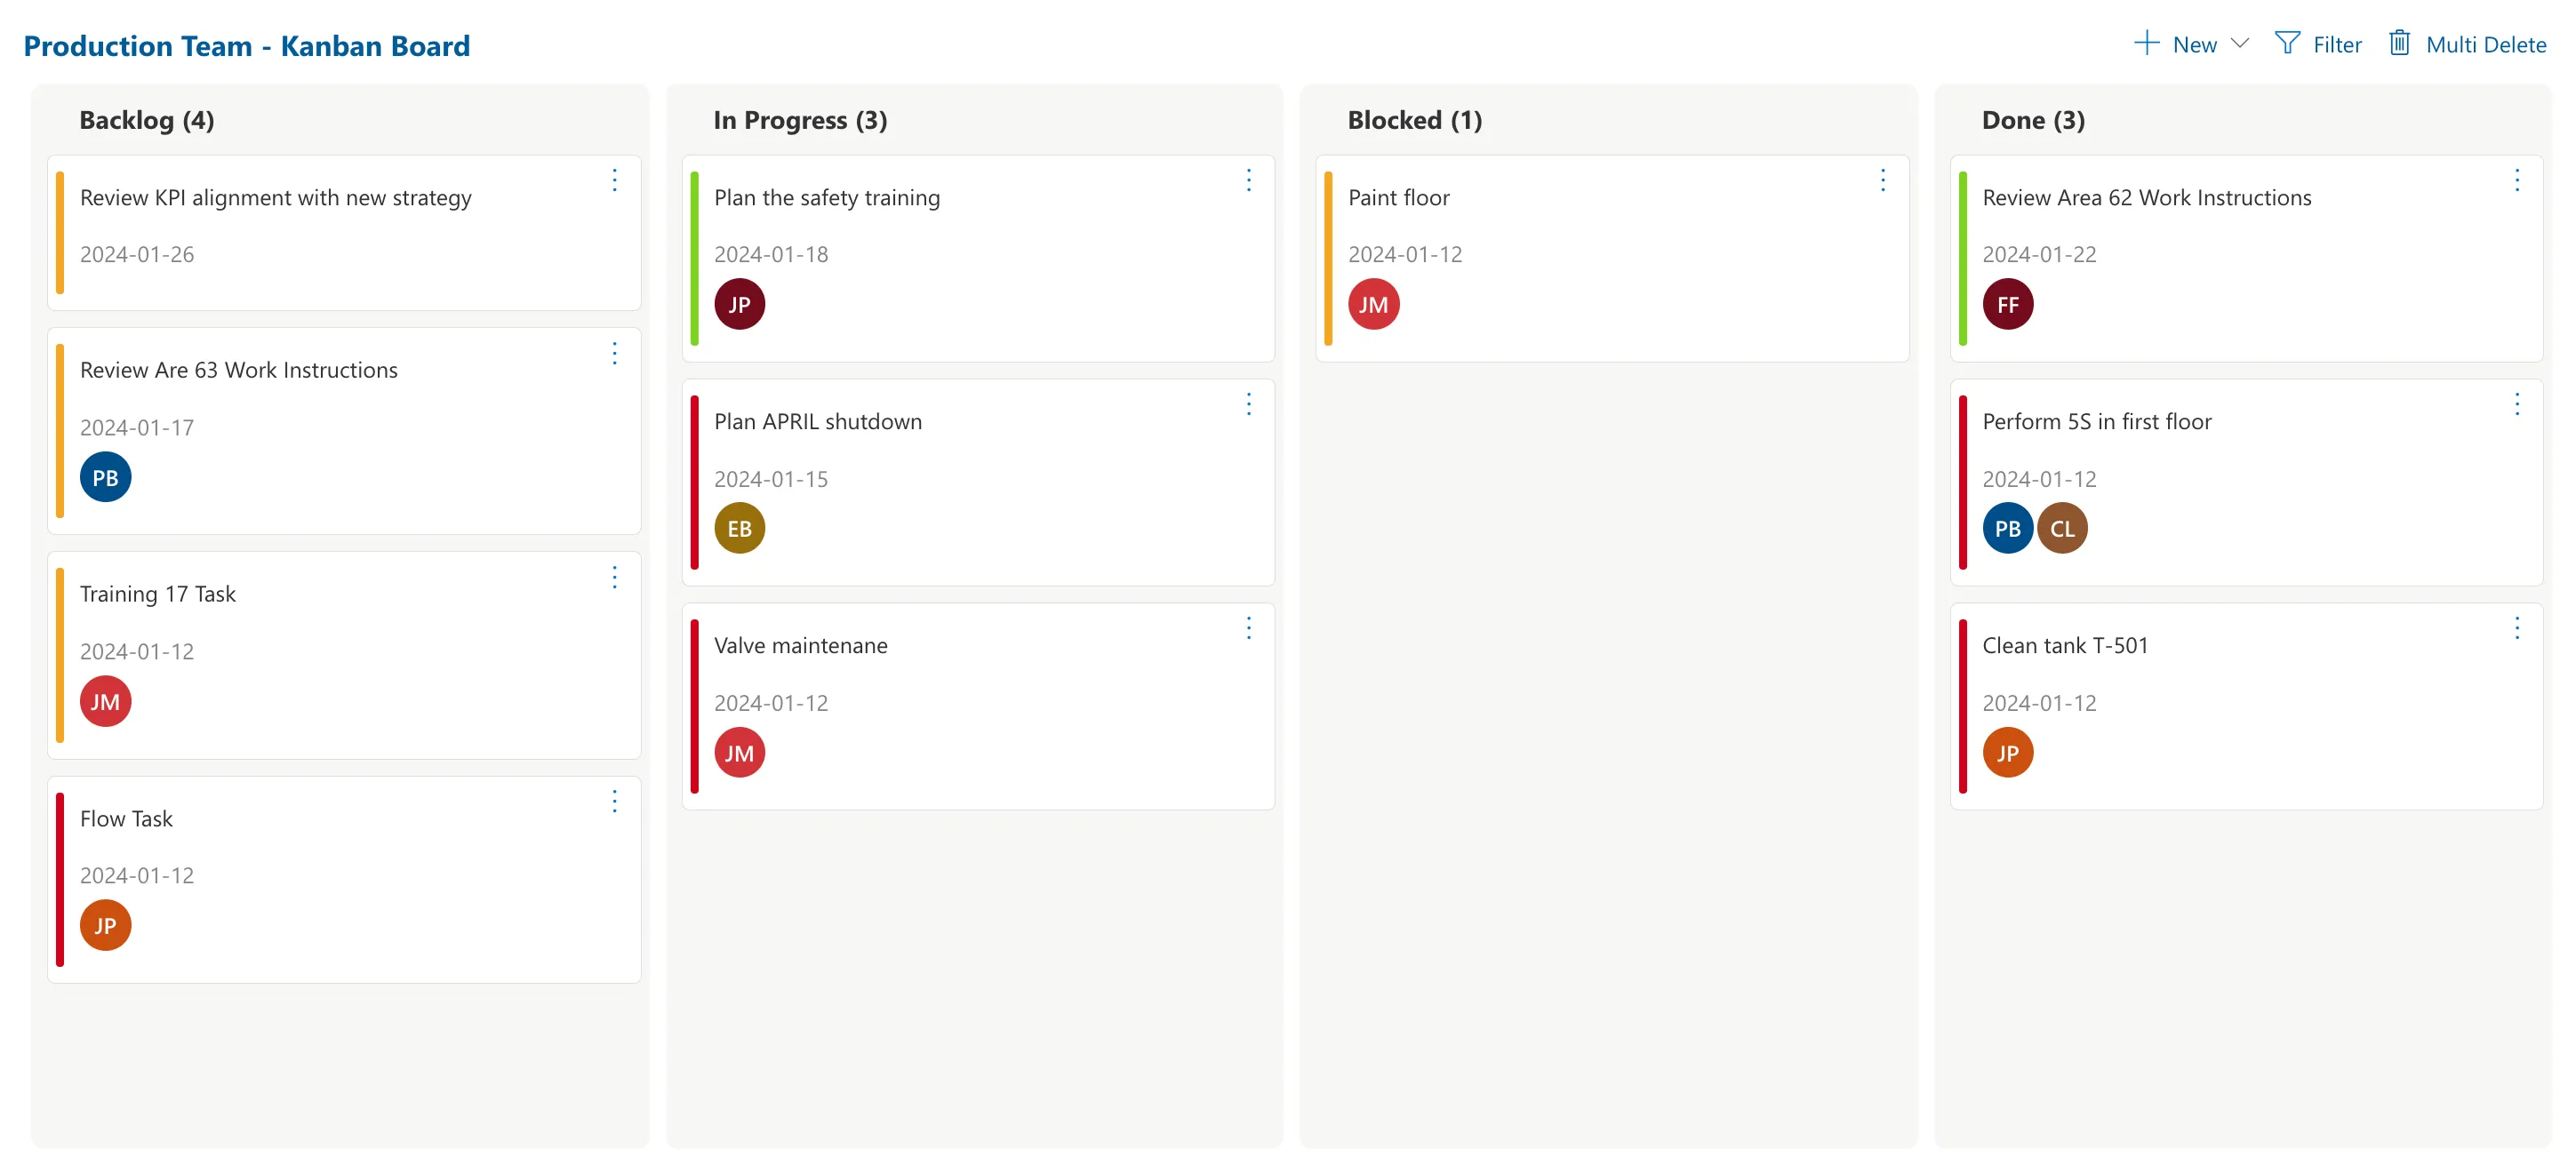 Image 4. Digital Kanban board to manage team workflow, as shown in the Cyzag platform.
.
2. Statistical and Quality Tools
Statistical Process Control (SPC)
SPC is a quality control method that employs statistical methods to monitor and control a process. This helps ensure the process operates at its full potential to produce a conforming product and improve efficiency. SPC can identify when processes do not behave according to their full potential and help guide actions to improve performance.
Statistical process control is a broad framework incorporating cause-and-effect analysis, checklists, control charts, histograms, Pareto charts, scatter diagrams, and stratification. Dr. Kaoru Ishikawa compiled this collection of process improvement tools known worldwide as the seven quality control (7-QC) tools. We will detail control charts and Pareto charts.
Control Charts
Control charts are a fundamental statistical process control (SPC) tool designed to monitor, control, and improve process performance over time. These charts help determine whether a manufacturing or business process is in a state of statistical control and identify the presence of special-cause variation, which is variation caused by external factors and not inherent to the process itself.
Rather than relying solely on averages, following process variations provides more valuable insights for plant staff to understand and manage process parameters. Significant improvements in overall averages can be achieved by identifying and addressing factors that cause outliers.
Essential elements of a control chart include a central line for the average, an upper control limit (3 standard deviations above the average), and a lower control limit (3 standard deviations below the average).
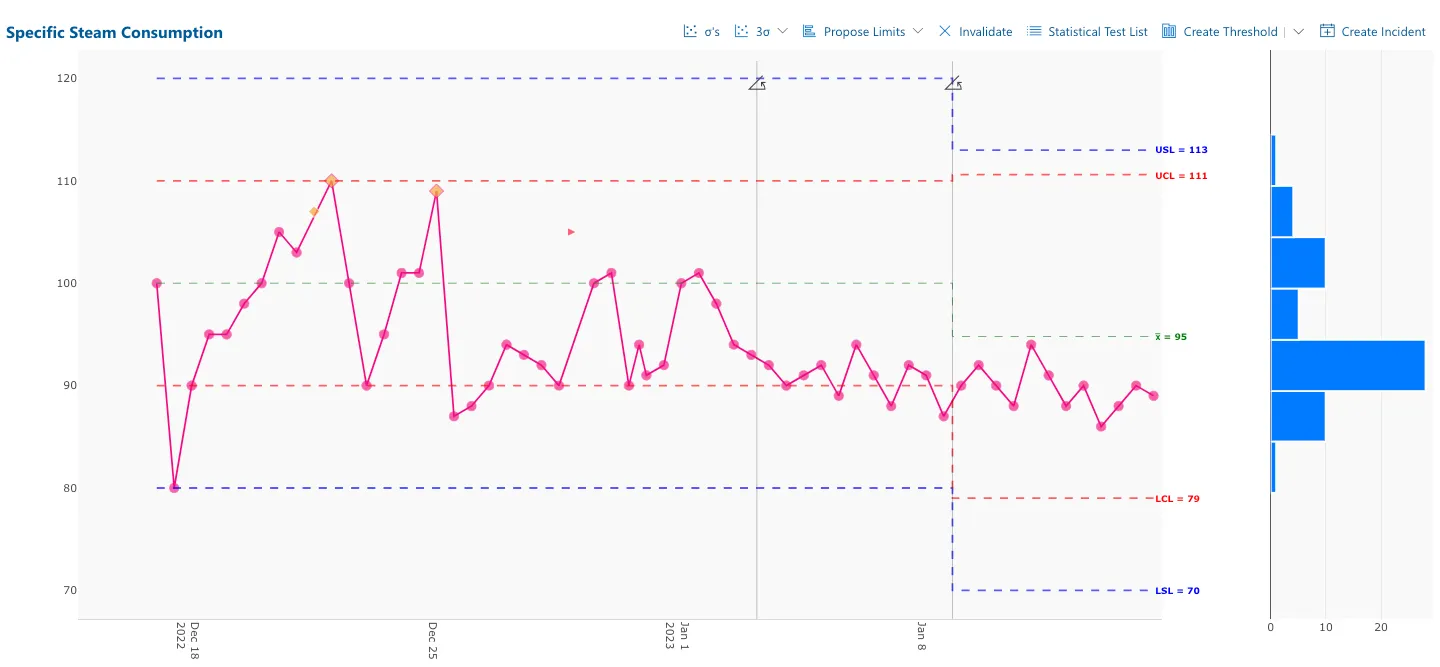 Image 5. Steam Consumption Control Chart as shown in the Cyzag platform.
Control charts are widely used in the process industry. They are instrumental in achieving high-quality products and enhancing operational performance. They enable teams to focus on significant process improvements through data-driven decision-making.
Pareto Charts
Also known as the 80/20 rule, the Pareto principle suggests that roughly 80% of effects come from 20% of causes. This principle is widely applicable in the processes industry, from manufacturing costs to safety incidents. In this context, 80% of the results can often be achieved by focusing 20% of the efforts on the most critical issues rather than tackling every issue simultaneously.
For instance, in a process manufacturing scenario where production losses cause delivery delays, it is recommended to concentrate resources on the crucial 20% that causes 80% of the problems, such as recurring equipment failures or raw material inconsistencies. This visual tool is a roadmap for targeted improvements and streamlined resource allocation.
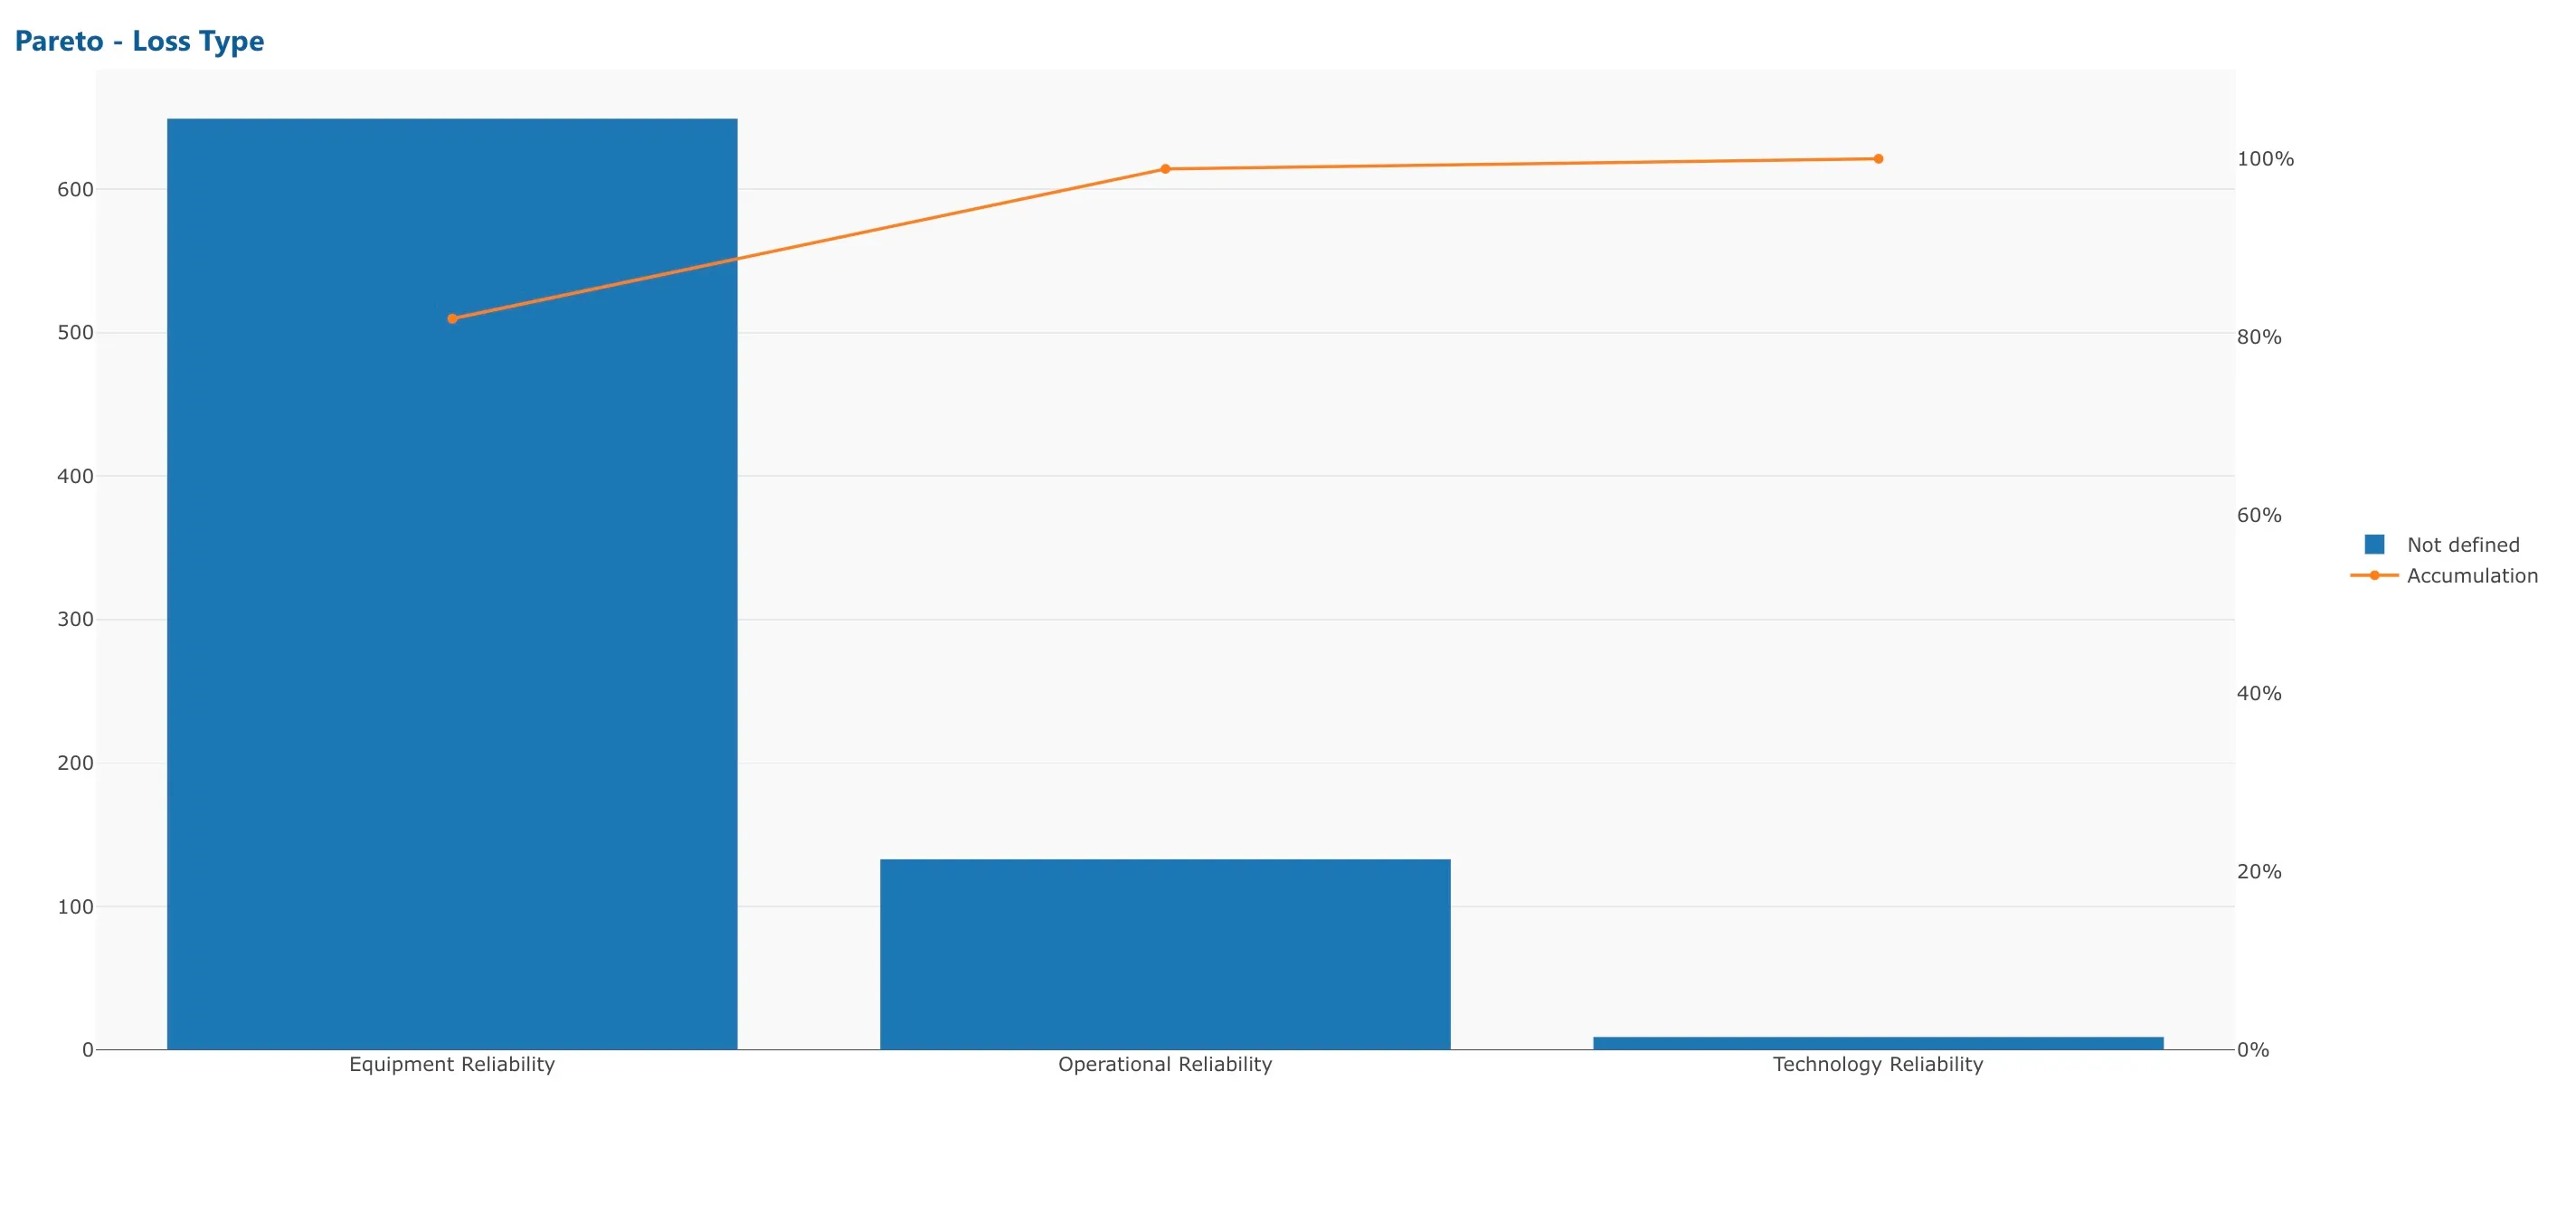 Image 6. Pareto chart showing production losses in the Cyzag platform.
Problem-solving tools can further enhance the effectiveness of the Pareto Principle. These platforms facilitate the management of data, the creation of Pareto charts, and the tracking of actions for root-cause analysis, streamlining problem-solving processes.
3. Problem Solving Tools
The problem-solving tools presented here are different Root Cause Analysis (RCA) types. RCA is a systematic process for identifying the root causes of faults or problems. It aims to address the cause of a problem rather than its symptoms, thereby mitigating the possibility of recurrence. There are different types of RCA, such as A3, the 5 Whys, the Fishbone Diagram, and Fault Tree Analysis (FTA).
Beyond merely solving problems, these tools foster knowledge-building and ownership among employees, empowering them to identify and address issues while promoting innovation and efficiency. Let’s delve into the details of some of them.
A3
The A3 tool is a structured problem-solving practice and continuous improvement approach originally developed by Toyota. The name “A3” refers to the standard paper size, 297 millimetres wide and 420 millimetres long, traditionally used to document the process. (The closest U.S. paper size is the 11-by-17-inch tabloid sheet.) This method is particularly effective in the process industry for addressing complex production issues and fostering an environment of continuous improvement.
Here’s how the A3 tool is typically used in problem-solving:
-
Background: Define the problem’s context and significance.
-
Current Condition: Describe the existing process and its issues.
-
Root Cause Analysis: Use tools like the 5 Whys to identify underlying causes.
-
Target Condition: Specify the goal statement for improvement or outcome.
-
Countermeasures: Develop actionable solutions for the root causes.
-
Implementation Plan: Outline steps, responsibilities, and timelines for executing solutions.
-
Follow-Up: Monitor the effectiveness of solutions and confirm problem resolution. Analyse the results and lessons learned to inform future improvements.
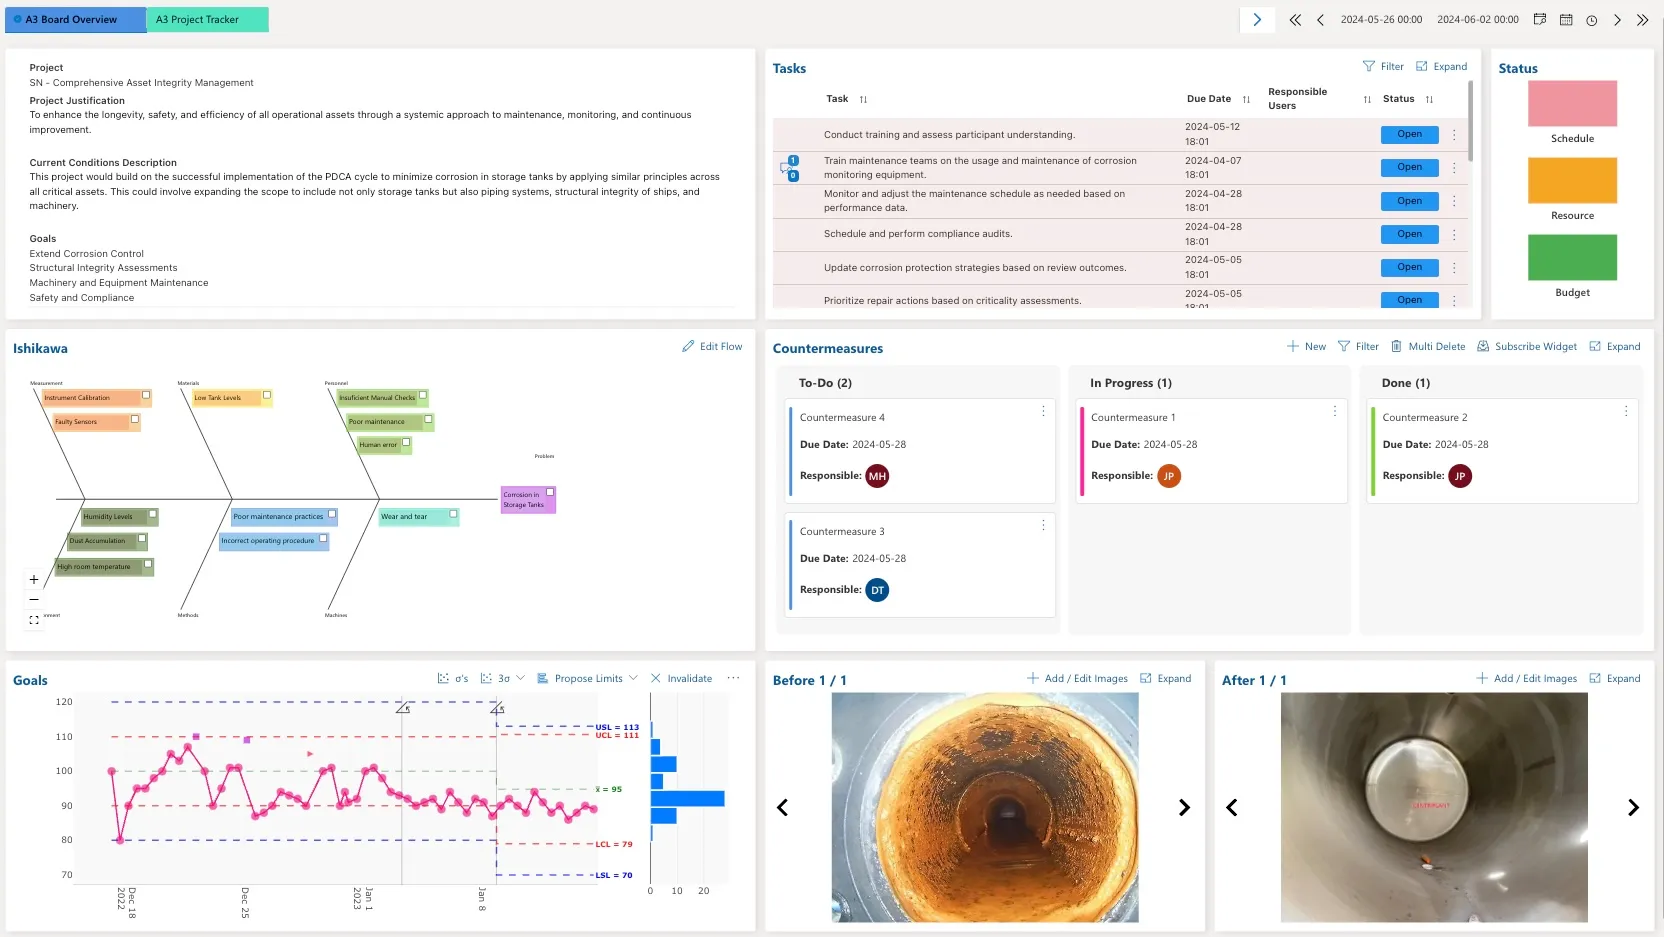 Image 7. A3 form within Cyzag platform.
This tool encourages a thorough investigation of problems and the development of solutions in a concise format that can be easily shared and discussed. It promotes transparency, accountability, and a systematic approach to problem-solving.
PDCA Cycle
The PDCA cycle (Plan-Do-Check-Act), or the Deming cycle, is a systematic, iterative process for continually improving processes, products, or services.
It can be considered a problem-solving tool since it encourages a methodical approach, promotes incremental adjustments, and continuously refines operations. However, it can also be categorised as a management or improvement tool.
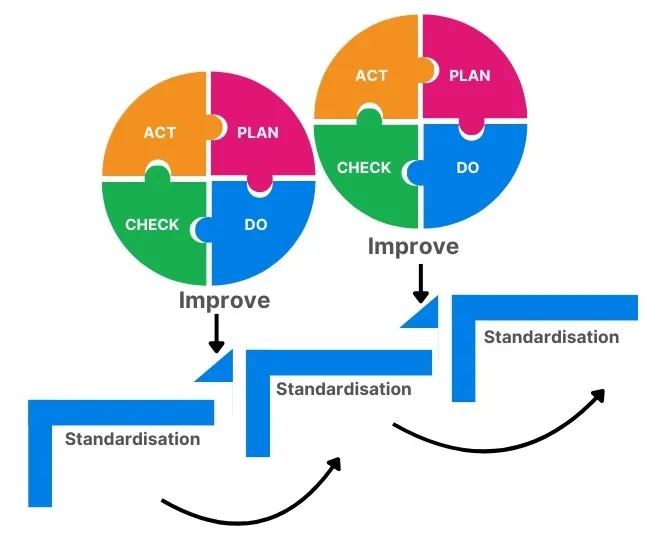 Image 8. PDCA Cycles.
The PDCA cycle is widely utilised in various industries and forms the backbone of many quality management systems, including those based on Lean manufacturing and Six Sigma principles. Here’s a brief overview of each phase:
-
Plan: Identify a goal or problem for improvement, develop hypotheses about the issues, and decide on changes or tests.
-
Do: Implement the plan and make the changes; this often takes place on a small scale to test the effect.
-
Check: Monitor and evaluate the change’s results or test against the expected outcomes to see if it made a difference.
-
Act: If the change proves successful, implement it more broadly and evaluate the results continuously. If the change fails to produce the desired outcome, restart the cycle with a revised plan. Standardise the improved solution you’ve developed and return to the first step to further enhance the process. Remember, the PDCA cycle is an endless journey of continuous improvement.
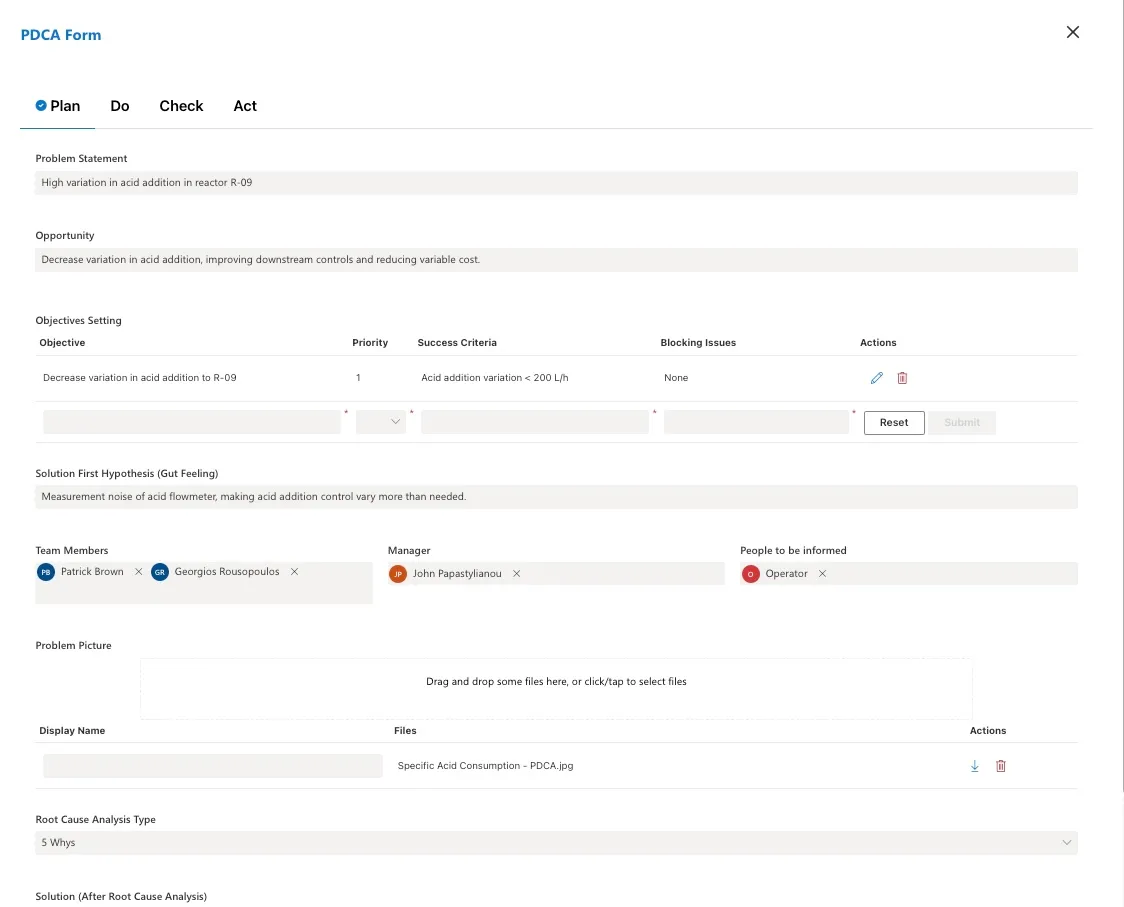 Image 9. PDCA Form within Cyzag platform.
The 5 Whys
This technique involves teams asking “Why?” repeatedly to drill down to the root cause of a problem. It’s simple and effective for straightforward issues. The significance of the number “five” lies in the iterative questioning process until the problem’s true origin is uncovered.
The 5 Whys process is similar to the A3. To exemplify it, let’s consider a scenario where a production decrease is identified at a manufacturing plant. Process operators can conduct a 5 Whys analysis, visually checking variable trends and registering the reason tree.
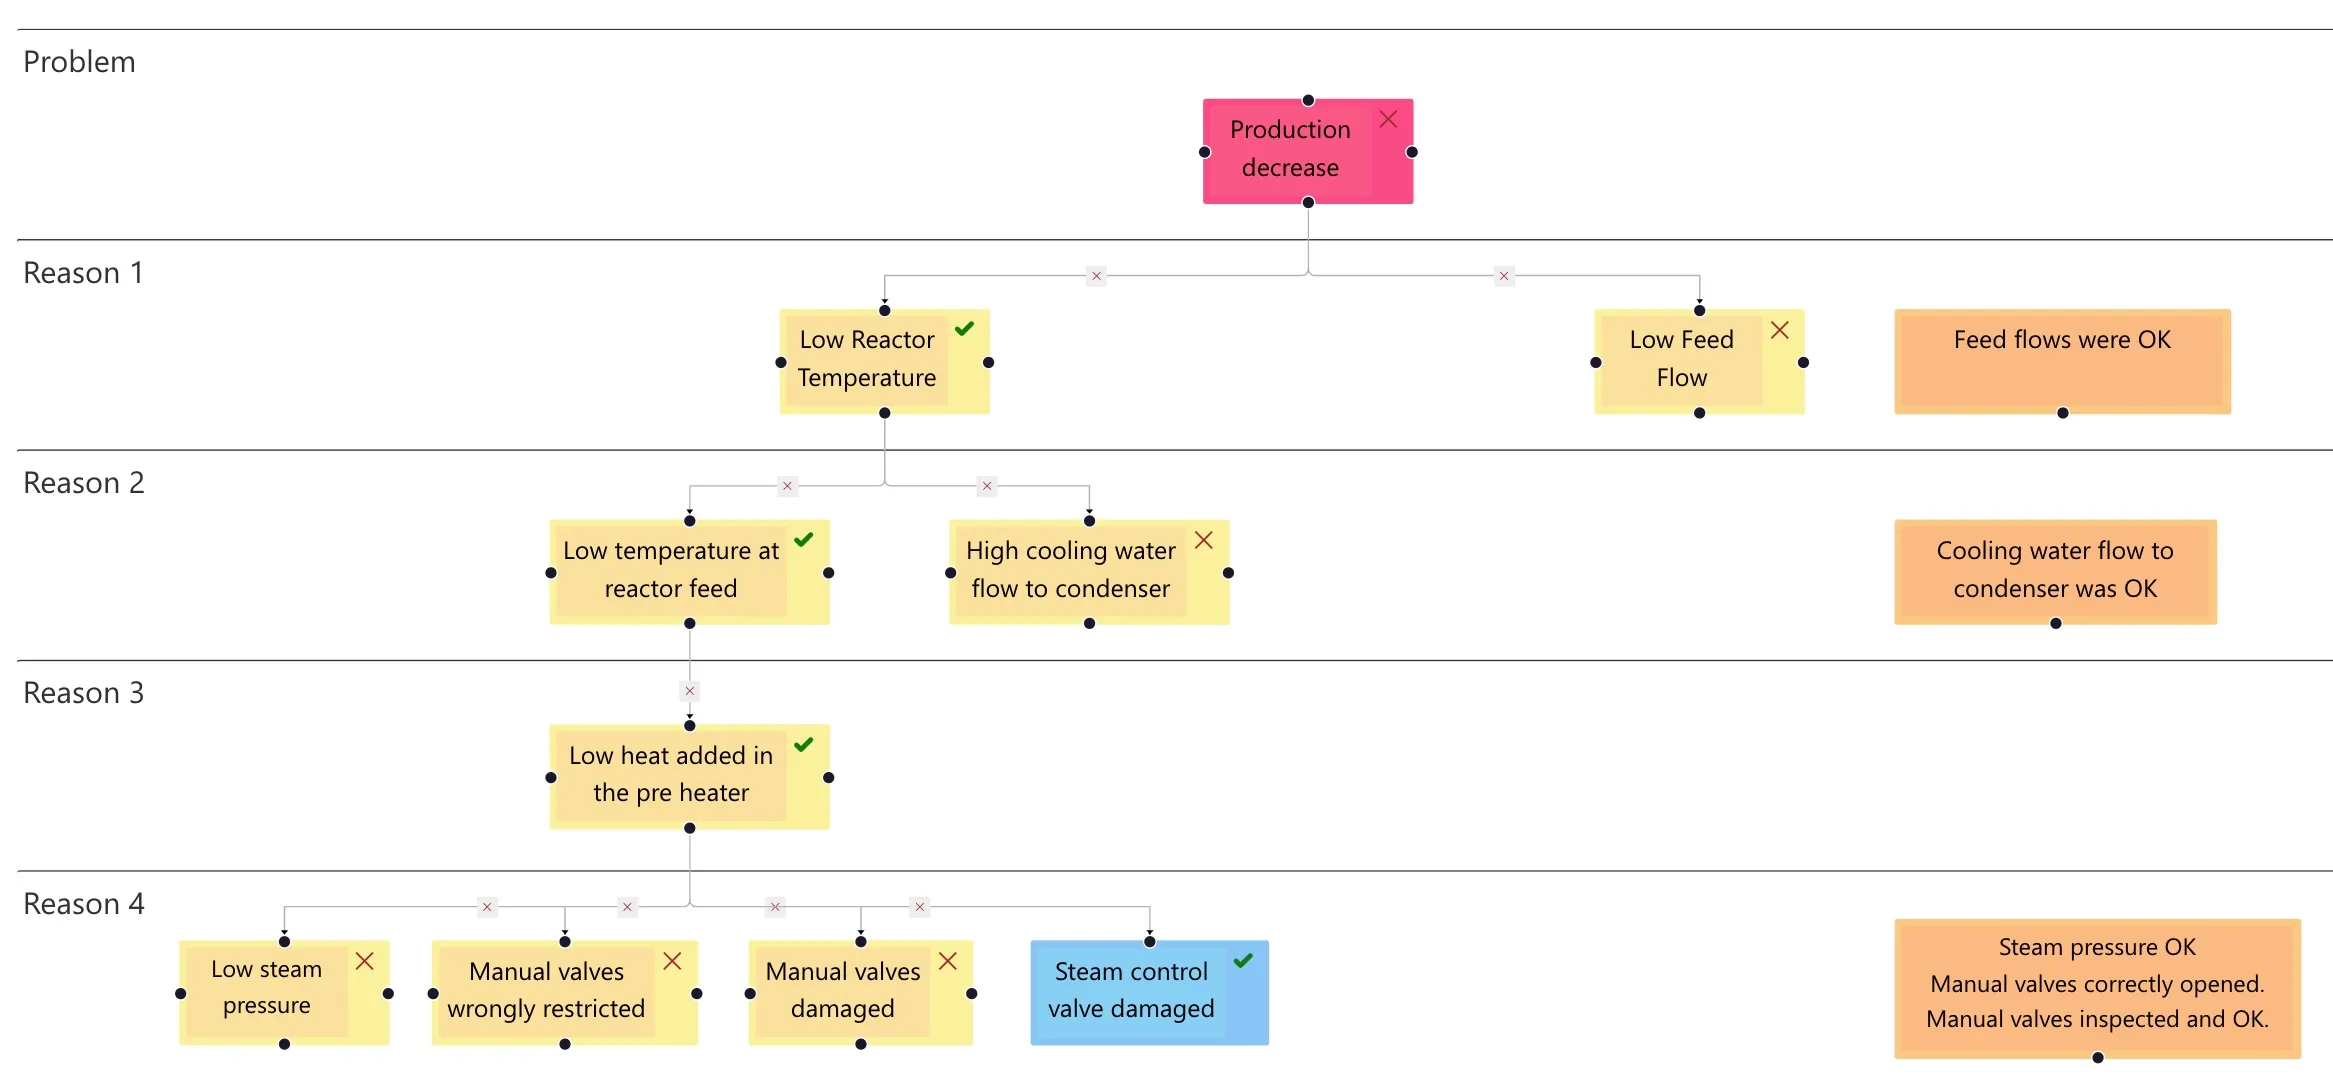 Image 10. The 5 Whys to discover root causes.
In this example, through the 5 Why process, they identified the damaged steam control valve as the root cause of the production decrease. Containment actions restore production to the planned rate while mid-term actions connected with a permanent solution are registered and assigned. They are followed up until closure during daily huddles.
Utilising digital visual tools enhances the effectiveness of the 5 Whys. They help collect and analyse data in a visual and digestible format, facilitating the visualisation and exploration of causes.
Ishikawa or Fishbone Diagram
The Fishbone Diagram, or the Ishikawa or Cause-and-Effect Diagram, is a visual tool for identifying a problem’s root causes. It organises potential causes into categories on branches that stem from a central spine ending in the problem statement. For the manufacturing industry, the standard categories are usually the 6 M’s: Method, Material, Manpower (Personnel), Measurement, Mother Nature (Environment), and Machine.
Each main category can branch into more specific sub-causes. This method facilitates thorough analysis and collaborative problem-solving by visually mapping the relationships between factors and the main issue. It’s especially effective when combined with other tools like the 5 Whys to explore causes more deeply.
In a manufacturing plant, for example, an engineer wants to discover the cause of a high level of corrosion in storage tanks, which results in maintenance costs and the unavailability of complete storage. He creates a fishbone diagram to determine the possible causes of the deviation. Once the cause is found, the corrective actions can be implemented, and the problem can be solved.
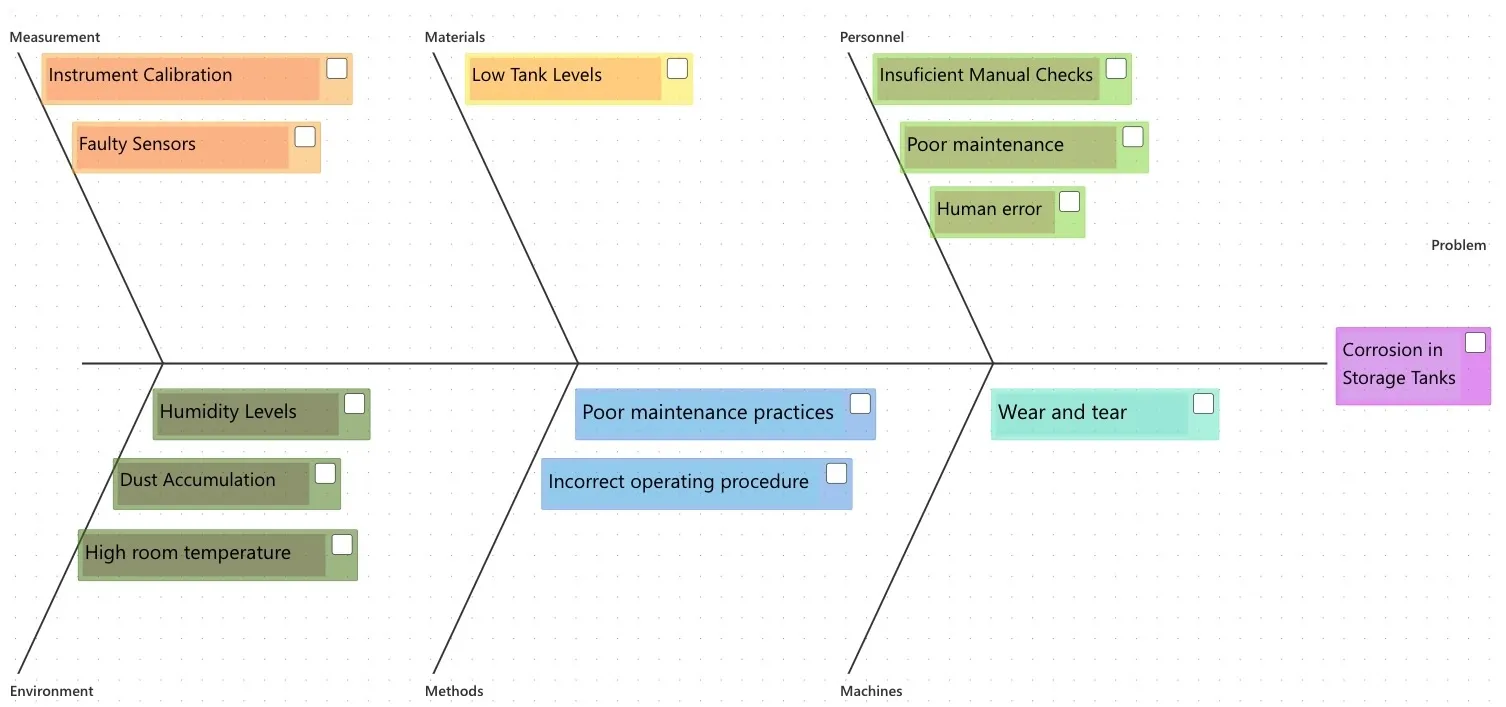 Image 11. Ishikawa Diagram Example.
4. Process Mapping Tools
Process mapping tools help visualise processes in various levels of detail and from different perspectives, offering a structured approach to analysing operational workflows, reducing manufacturing costs and improving efficiency. However, each tool explained here provides a different level of detail and focuses on different process elements, making them complementary rather than interchangeable.
Process Flow Diagrams (PFDs)
PFDs provide a bird’s-eye view of the major parts of a plant or system. Typically used during the engineering phase in process industries, they outline relationships between major components such as pipes, reactors, pumps, and tanks. PFDs focus more on the physical flow of materials rather than detailed, step-by-step operations.
Process flow diagrams are crucial in chemical manufacturing, oil refining, and other process-heavy sectors. They offer a clear and simplified overview of the entire process, aiding stakeholders from operators to engineers and management. This visualisation helps everyone understand the process flow at a glance, including how different components and stages interconnect. Such clarity is essential for identifying potential areas for improvement.
PFDs also assist in identifying bottlenecks, facilitate systematic analysis, enhance safety, and support process optimisation. Moreover, they are vital for training and communication, creating a shared understanding of the process, which is crucial for effective teamwork and problem-solving.
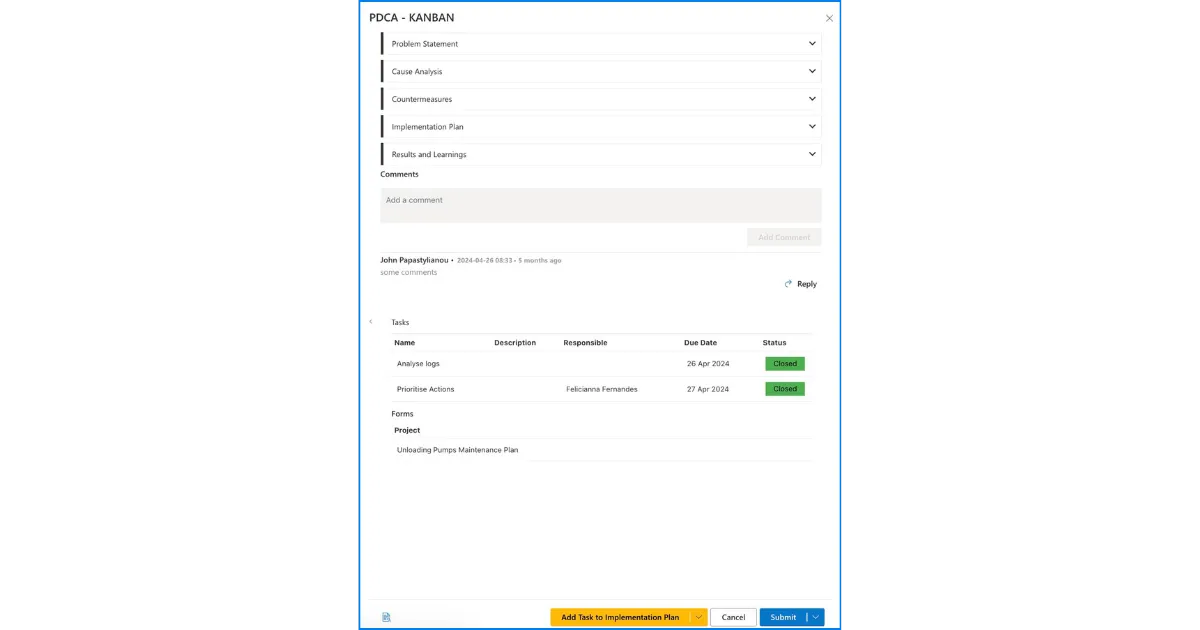 Image 11. Process Flow Diagram.
SIPOC
SIPOC is a tool that provides a high-level view of a process, highlighting Suppliers, Inputs, Processes, Outputs, and Customers without going into detailed operational steps. It is more about understanding the scope and boundaries of a process with a quick look, and it is widely used when working with the DMAIC methodology.
In the process industry, SIPOC is used to identify all relevant elements of a process improvement project during the planning phase. It helps understand how changes to the process will impact suppliers, inputs, outputs, and customers. This is particularly useful in complex chemical or manufacturing processes where multiple stakeholders and operations must align for effectual output.
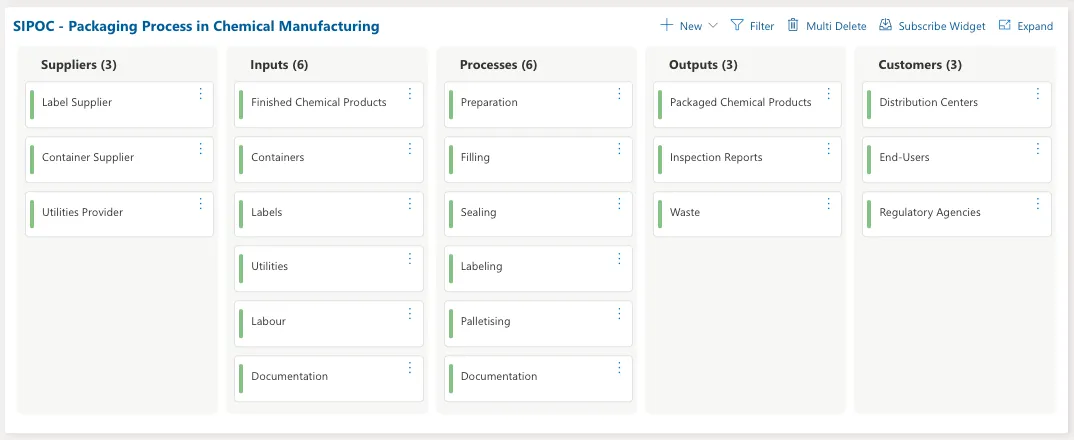 Image 12. SIPOC Example.
Process Flowchart
A Process Flowchart is a graphical representation of a process, showing the steps as boxes of various kinds and their order by connecting them with arrows. This diagrammatic representation illustrates a solution model for a given problem, making it useful for improvement initiatives. Flowcharts are versatile and can be used for everything from simple office procedures to complex production processes.
Flowcharts are widely used in the process industry to document, design, and analyse large-scale processes such as chemical manufacturing, food processing, or any operation requiring granular steps. They help identify redundancies and non-value-added operations during improvement initiatives, promoting a more streamlined workflow.
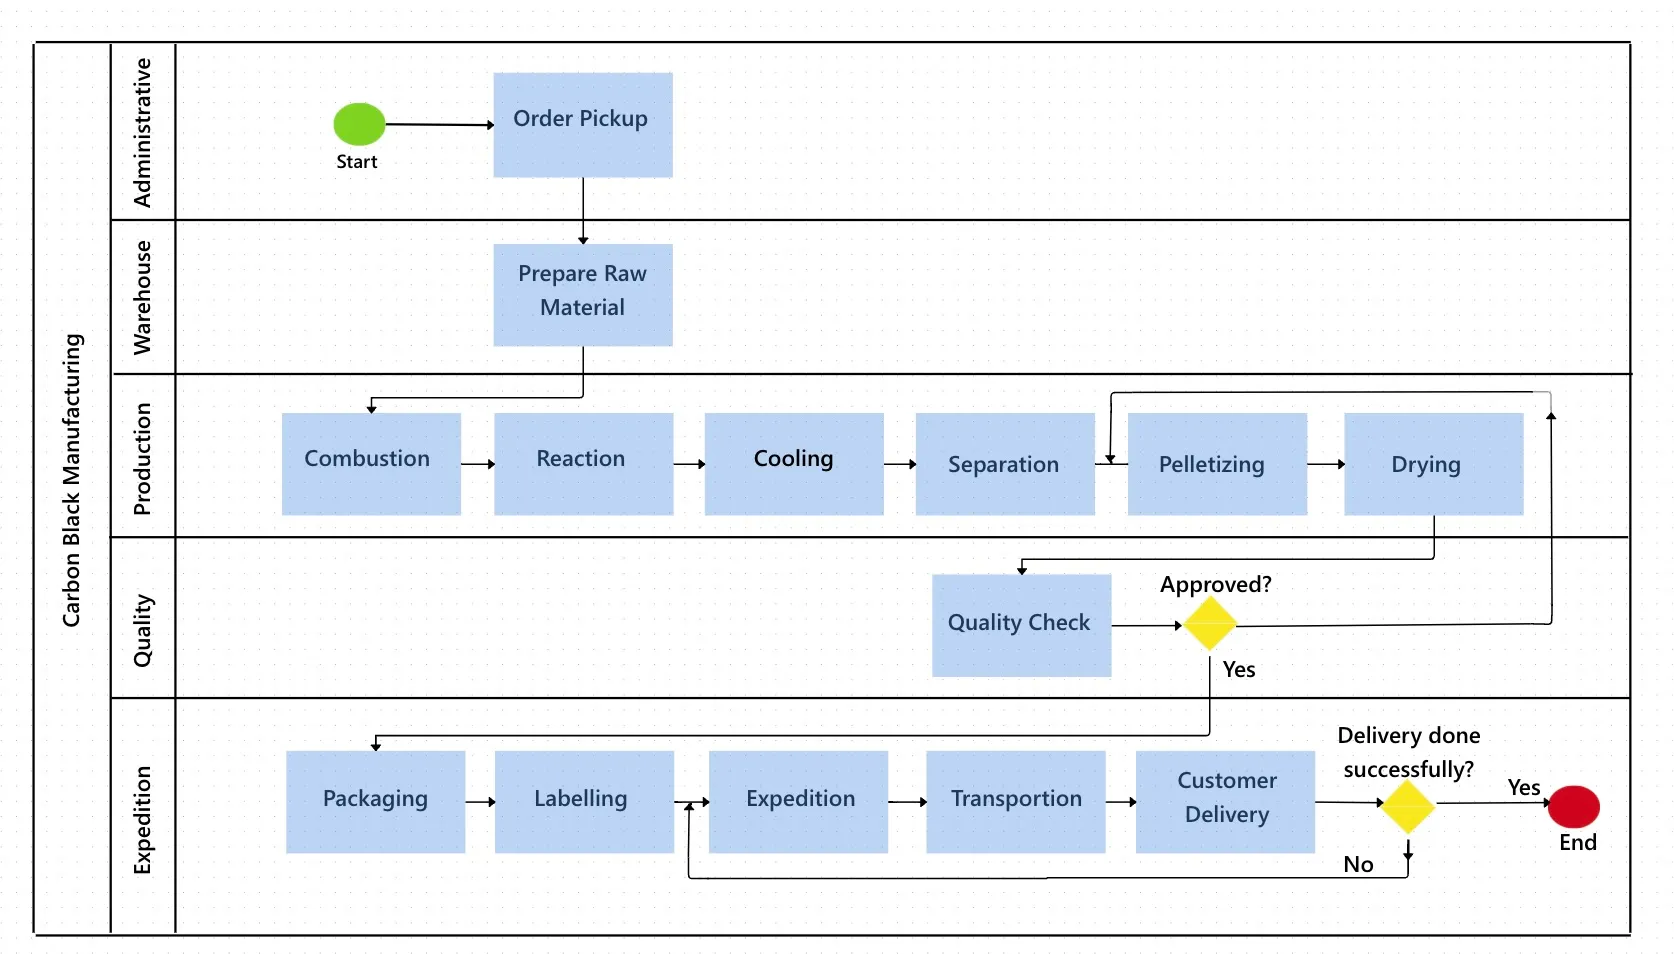 Image 13. Manufacturing Process Flowchart within Cyzag platform.
Value Stream Mapping (VSM)
Value Stream Mapping (VSM) is a lean management method used to analyse and design the stages from product inception to delivery to the customer. VSM helps identify waste and optimise production processes in the process industry. The method involves drawing a map that details every step of material and information flows, incorporating data and metrics such as cycle times, downtimes, inventory levels, and throughput to enhance process understanding and efficiency.
VSM identifies various forms of waste—including delays, bottlenecks, and excess inventory—which is crucial in complex, energy-intensive industries where minimising waste significantly boosts cost efficiency. Moreover, it provides a clear visualisation of the value flow from raw materials to finished products, pinpointing value-adding and non-value-adding activities. This visibility is essential for applying lean strategies effectively, focusing on enhancing valuable steps and eliminating inefficient ones.
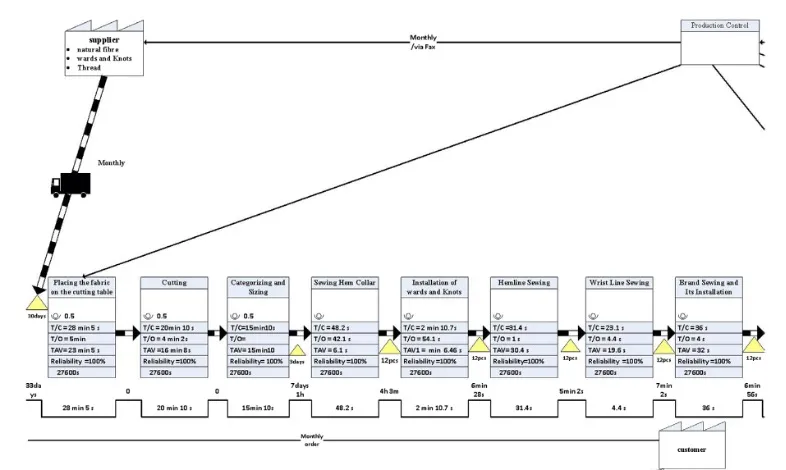 Image 14. Part of a Value Stream Mapping for Industry.
VSM is a continuous process improvement tool, not a one-off activity. Regular updates to the value stream map allow companies to identify improvement opportunities and monitor changes’ effects persistently. Furthermore, the insights derived from VSM can guide strategic decisions, such as equipment investments and workflow modifications, enabling management to make well-informed decisions based on a comprehensive understanding of the entire value stream.
5. Optimisation and Reliability Tools
This section discusses a suite of tools designed to enhance the effectiveness and consistency of processes in industrial environments. Each tool serves a specific purpose, but collectively, they contribute to a more robust and efficient operational framework.
Gemba Walks
Gemba Walks are a practice that encourages leaders to observe processes at the place where work happens, which in the process industry could be the production floor, maintenance workshop or any operational area. Japanese companies often supplement Gemba with the related term “genchi genbutsu” — essentially “go and see for yourself” — to stress the importance of empiricism.
This practice helps leaders see for themselves how operations are conducted and identify inefficiencies (non-value-added activities), safety issues, or deviations from standard operating procedures. It promotes open communication between management and front-line workers, providing insights that might not be captured through reports or second-hand information. Gemba Walks also reinforce a continuous improvement and problem-solving culture among all employees.
Standard Operating Procedures (SOP) and Standard Work Steps (SWS)
Standard Operating Procedures (SOPs) are the backbone of efficient and consistent operations in the process industry. While they may not always seem like typical improvement process tools, SOPs play a crucial role in optimising processes by providing a clear framework for how tasks should be performed.
By documenting the step-by-step procedures for carrying out various activities, SOPs establish a baseline standard that ensures consistency, quality, and safety across operations. Moreover, SOPs serve as the initial point of reference for identifying areas of improvement. By detailing current practices, SOPs enable organisations to assess what is being done, recognise inefficiencies or bottlenecks, and pinpoint opportunities for enhancement.
In addition to SOPs, Standard Work Steps (SWS) further enhance process optimisation by standardising the execution of specific tasks within the broader framework established by SOPs. SWS delineate the precise sequence of actions, tools, and resources required to complete a task efficiently and effectively. By defining the best-known method for carrying out individual activities, SWS eliminate variability, reduces errors, and improves productivity. Furthermore, SWS facilitate continuous improvement by serving as a basis for evaluating the effectiveness of existing processes and identifying opportunities for refinement.
Together, SOPs and SWS form a dynamic duo in the process industry, providing a solid foundation for operational excellence and serving as essential tools for ongoing optimisation efforts.
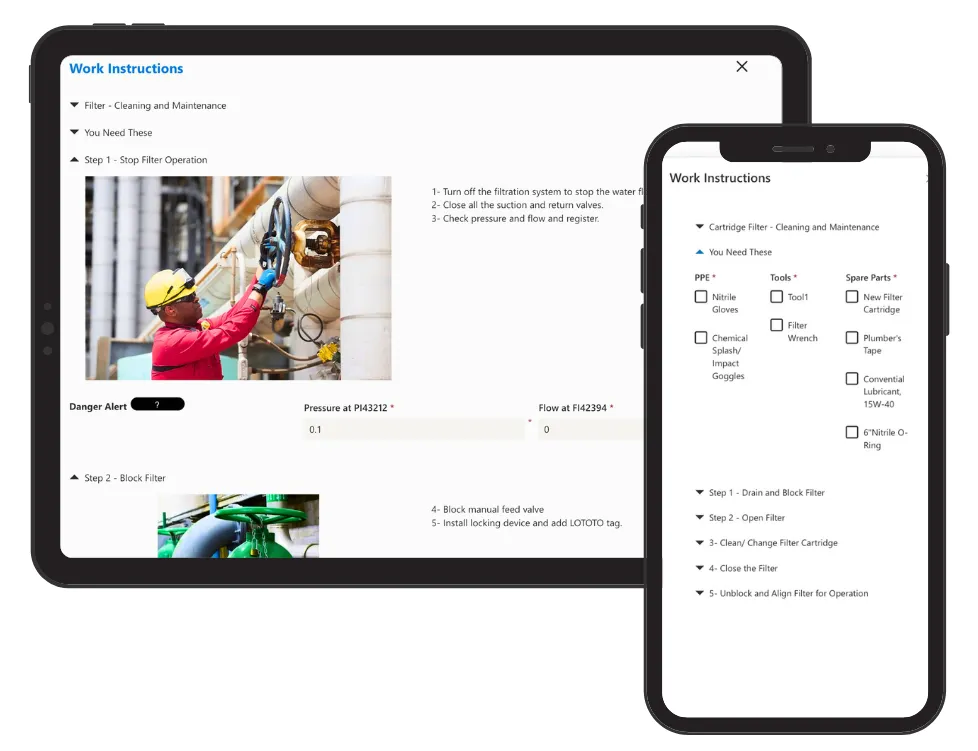 Image 15. Standard Work Steps (SWS) example in Cyzag platform.
Short Interval Control
Short Interval Control (SIC) is a management technique that enhances operational efficiency in short periods, typically one to four hours. It is particularly effective in manufacturing environments where rapid feedback and continuous adjustments are crucial for productivity and efficiency. Digital visual tools like the Cyzag platform are essential for real-time trends and contextual data.
SIC’s primary advantage is its ability to bring data-driven decision-making closer to the operational source, maximising speed, efficiency, and profitability. Frontline staff in process plants can identify improvement opportunities, monitor efficiency, and key process data in real-time. This enables them to make informed decisions, take immediate action, and prevent losses and hazards before they escalate.
The critical aspects of short interval control are:
-
Frequent Monitoring: SIC is about frequently checking production against the plan within short intervals (hence the name). This allows managers and teams to quickly identify when a process deviates from its expected output and make immediate corrections.
-
Real-Time Data: It relies on real-time data collection and analysis to make informed decisions quickly. This data might include production volumes, cycle times, downtime, and quality metrics.
-
Action-Oriented: The focus is on taking prompt actions based on the insights gained from the data to correct or improve the process throughout a shift.
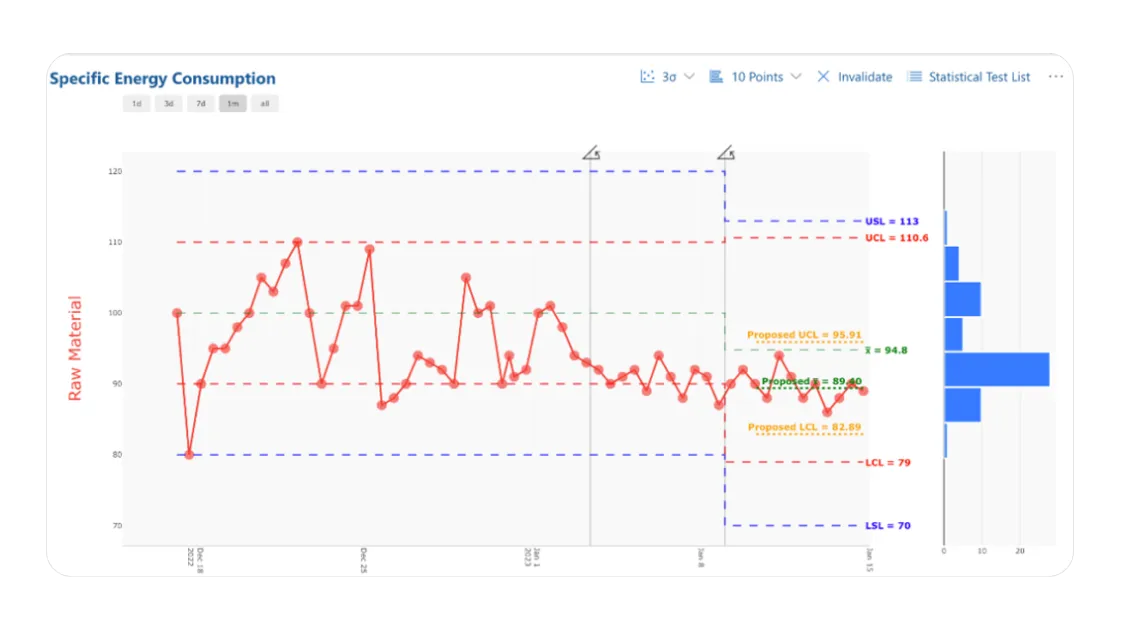 *Image 16. Short Interval Control Applied to Energy Consumption. *
SIC is more immediate and action-oriented than traditional statistical process control (SPC) analyses. It addresses variations and inefficiencies as soon as they are observed, making it a powerful tool for the process industry, where conditions and demands can change rapidly within a single shift or production cycle.
Failure Modes and Effects Analysis (FMEA)
Failure Modes and Effects Analysis (FMEA) is instrumental in the process industry for process improvement, enhancing reliability and safety. This method systematically reviews components, assemblies, and subsystems to identify potential failure modes, their causes and effects on system operations, and the risks associated with specific failures. It can also be considered a root cause analysis tool with a much more preventive approach.
FMEA helps organisations systematically evaluate processes or products to identify potential failure points before they lead to actual problems. By analysing these failure modes, their causes, and their potential effects, teams can implement corrective actions to mitigate risks.
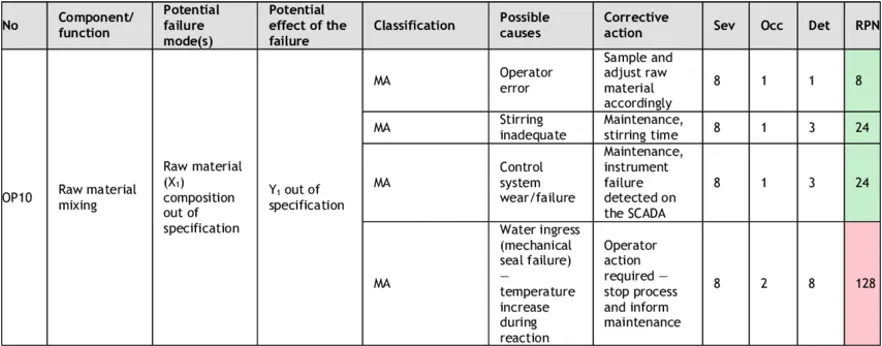 Image 17. FMEA Example.
In industries like oil and gas, pharmaceuticals, and chemicals, where failures can have severe consequences, FMEA is used to design out failures and plan effective preventative maintenance strategies to reduce downtime and extend the life of the equipment.
The strength of FMEA lies in its proactive approach to identifying, prioritising, and addressing vulnerabilities in a system or process. This anticipation of problems allows for strategic planning to avoid failures, improve safety, enhance quality, and ensure reliability, thus solving problems before they occur. While it’s mainly preventive, FMEA also contributes to continuous improvement efforts by revealing opportunities for process enhancements and innovation.
6. Digital Tools
Incorporating digital tools as part of process improvement offers a pathway to transforming traditional operations into more efficient, reliable, and scalable systems. These tools enable precise monitoring, automation, and optimisation of industrial processes, providing real-time data and analytics to make informed decisions and predict potential issues before they arise. Some of the most valuable digital tools are:
SCADA Systems
Supervisory Control and Data Acquisition (SCADA) systems are essential for managing and monitoring industrial processes locally and remotely. They collect and visualise real-time data, enabling quick responses to operational deviations or emergencies.
SCADA enhances process improvement by continuously analysing operational data to detect inefficiencies, predict equipment failures, and optimise production processes. This constant monitoring boosts productivity, reduces waste, and improves output quality through timely adjustments. However, modifying SCADA configurations or adding data requires specific technical knowledge and careful handling to avoid operational disruptions and ensure system integrity.
Integrating SCADA systems with digital operations platforms enhances their capabilities by centralising data management across multiple sites. This centralised approach provides a more comprehensive view and improved control over operations, facilitating deeper analytics and more informed decision-making. The synergy between SCADA and digital platforms streamlines operations, automates data analysis, and enhances response times. Additionally, this integration aids continuous improvement by enabling the evaluation of process changes and the optimisation of operations across the enterprise, leading to greater operational efficiency and sustainability.
Digital Operations Platform
These platforms serve as centralised hubs for managing and optimising industrial operations. They integrate various data sources and systems, providing a cohesive view and control over the processes connected to production.
Digital Operations Platforms enable seamless communication across departments, facilitate better resource allocation, improve process transparency, and enhance operational efficiencythrough real-time analytics and automated workflows. It transforms data into actionable insights through advanced analytics and visual representations. They help identify trends, patterns, and anomalies, uncovering cost savings opportunities and nurturing continuous improvement efforts.
An example of such a platform is Cyzag. Cyzag helps industries streamline their operations by integrating data from multiple sources into a single, accessible platform. It provides tools for managing operational routines, process monitoring, analytics, and performance analysis, which are crucial for making informed decisions quickly and efficiently. Everything is in one place, reducing the need for change management and training and encouraging people to contribute.
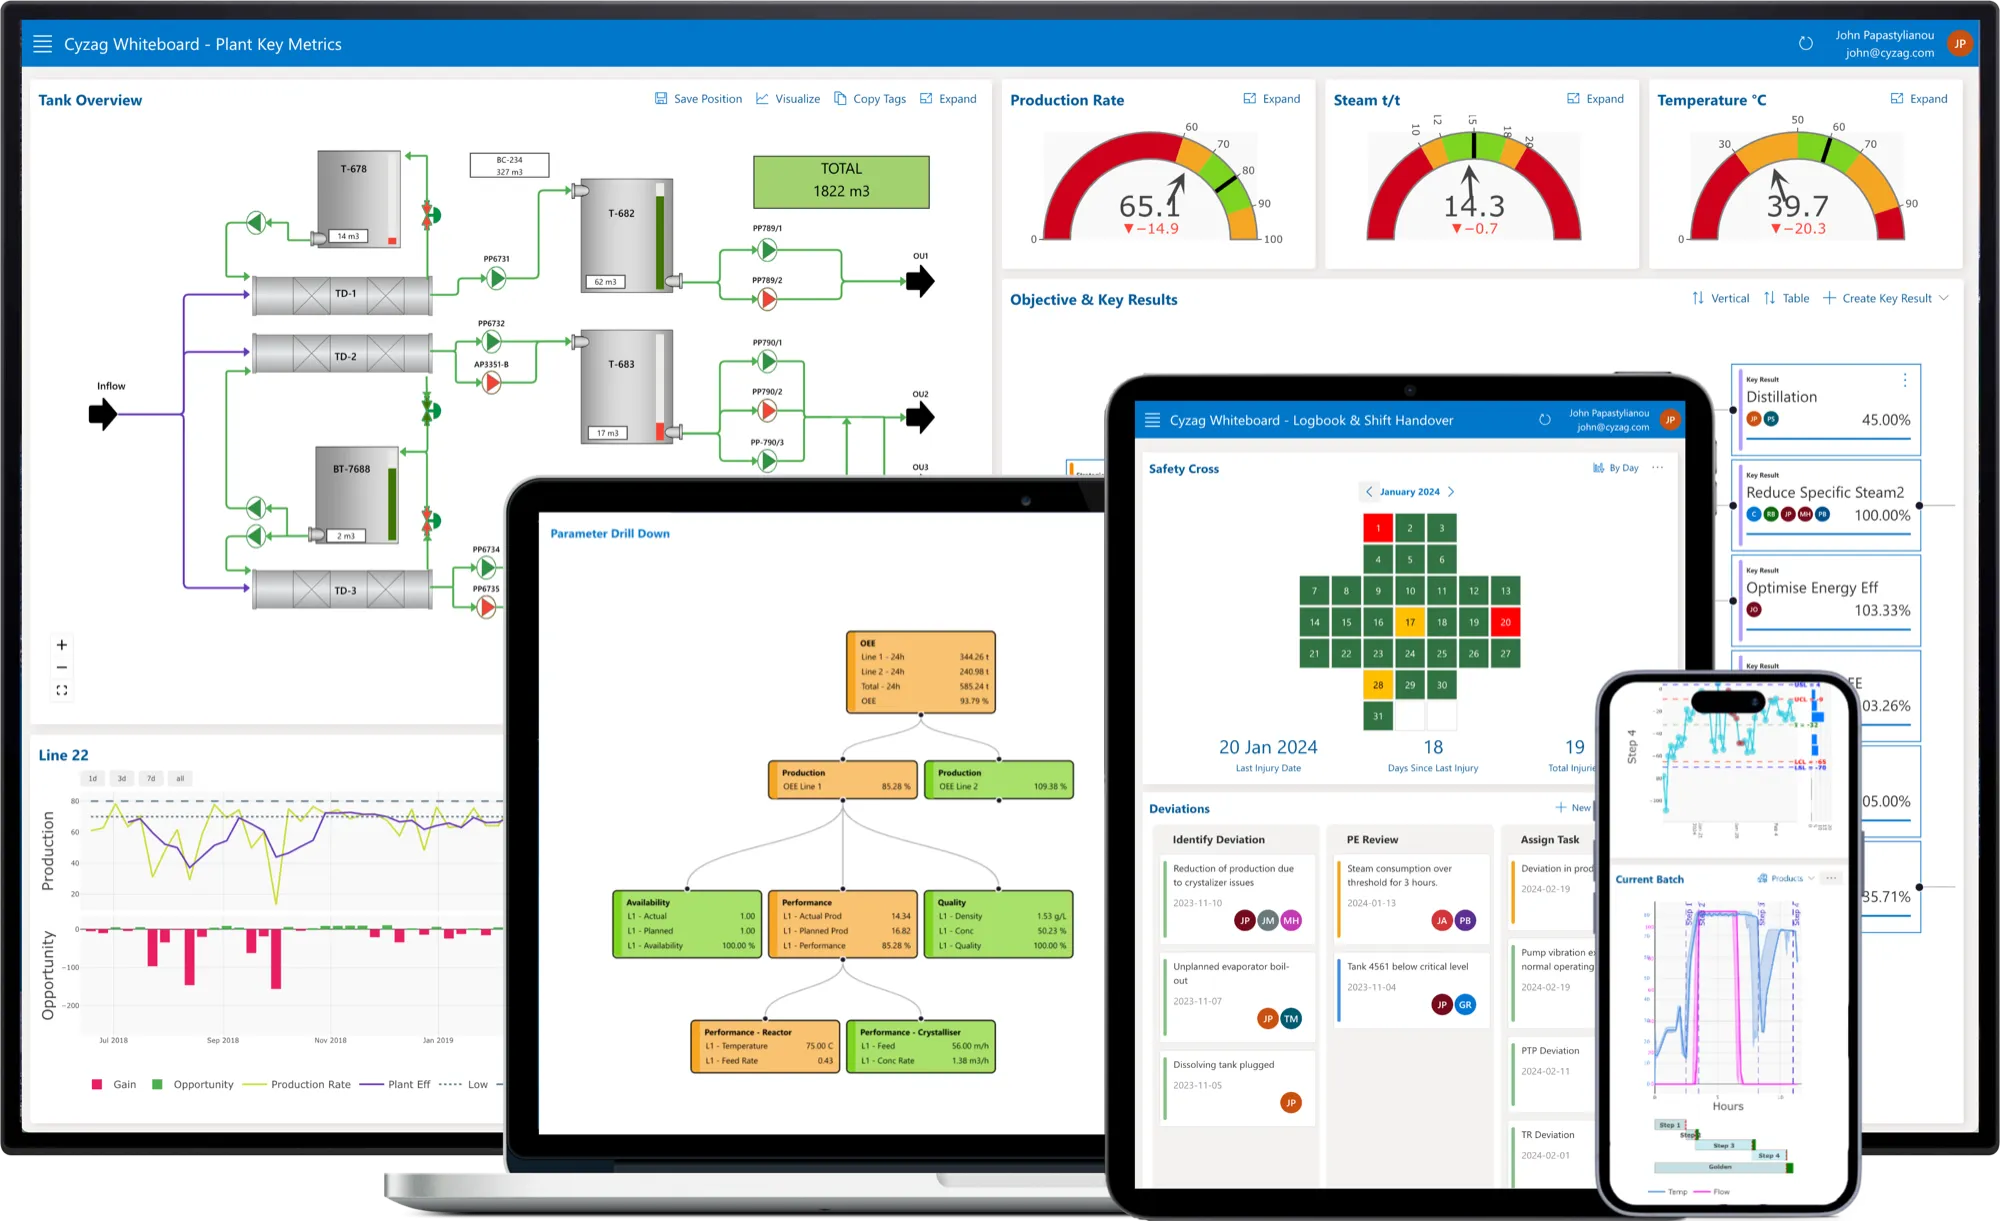 Image 18: Cyzag is a Digital Operations Platform.
The Cyzag platform is designed with a user-friendly, no-code interface that allows workers at all levels of technical proficiency to configure and use them easily. This ensures broad accessibility and empowers employees across the organisation to contribute effectively to operational enhancements.
By leveraging such platforms, organisations can anticipate operational issues, optimise processes, and ensure consistent alignment with business objectives, significantly and sustainably improving productivity and operational excellence.
Process Simulation Software
This type of software allows for modelling production processes to predict the behaviour of process systems under various conditions. It helps identify process bottlenecks and test process changes without affecting actual operations, saving costs and time.
Although highly beneficial, this software often requires a foundational understanding of statistics and mathematics, making it essential for users to have specialised knowledge to leverage its capabilities thoroughly.
Enterprise Resource Planning (ERP) Systems
ERP systems integrate all facets of an operation, including planning, purchasing, inventory, sales, marketing, finance, and human resources. They improve data sharing and management across the organisation and enhance decision-making by providing a unified source of truth. However, while ERP systems offer significant benefits, they also present some challenges. These include high initial and ongoing costs, complexity in implementation, and rigid structures that often require organisations to modify their existing processes to fit the software’s constraints.
IoT (Internet of Things)
IoT (Internet of Things) technology connects physical devices across the production line to the internet, allowing for data collection and exchange. This connectivity enables manufacturers to monitor real-time operations, optimise efficiency, and predict maintenance needs more precisely. By integrating IoT, factories can leverage predictive analytics to anticipate equipment failures before they occur, minimising downtime and extending machinery life. Furthermore, the data generated by IoT devices is crucial for deriving actionable insights and fostering continuous improvement initiatives, ensuring that operations are efficient and constantly evolving to meet changing demands.
Predictive Maintenance Tools
Predictive maintenance tools use AI and machine learning algorithms to analyse data from various sources, such as sensors, IoT devices, and operational logs, to accurately predict equipment failures before they occur. This proactive approach reduces unexpected downtime and also extends the life of machinery by enabling timely and targeted maintenance interventions.
These tools significantly cut maintenance costs and enhance overall equipment effectiveness (OEE) by effectively predicting potential breakdowns. Additionally, predictive maintenance facilitates better resource allocation and improves the safety of the work environment, as it minimises the risk of sudden equipment failures that could endanger operators.
Conclusion
In this exploration of tools for process improvement within the chemical and process industry, we have outlined the vital role of a balanced toolkit that encompasses traditional methods such as 5S, Kanban, statistical quality control, and problem-solving methodologies, as well as cutting-edge digital technologies. Tools like SCADA systems, digital operation platforms, predictive maintenance software and IoT devices must be integrated thoughtfully with time-tested practices to maximise their effectiveness in enhancing operational efficiency and supporting sustainable growth.
However, it’s crucial to recognise that introducing new tools alone is not a panacea for organisational issues. Before implementing new tools, understanding and optimising existing processes is essential. A new tool, without proper integration and consideration of the existing people and processes, rarely resolves ongoing challenges on its own.
This comprehensive approach—encompassing people, processes, and tools—forms the bedrock of our strategy, guiding organisations towards achieving operational excellence. Our discussion highlights the importance of a cohesive and efficient manufacturing ecosystem that leverages technological advancements and supports and empowers the workforce, ultimately fostering sustainable growth and operational success.
Read part one: How to Start with Process Improvement: People Read part two: How to Start with Process Improvement: Processes.
Follow Cyzag on LinkedIn for new articles and stories.